Section 4 - How to Use the Map
This section provides guidance on using the Green Infrastructure Map.
Overview
The map page displays all of the publicly accessible datasets that have been used to develop the Green Infrastructure Standards at a national level. These are presented as separate layers. You can customise the map by switching on the layers that are of interest to you.
There are five main areas to the map page
- Sidebar
- Main map view
- Toolbar
- Scale and location
- Base maps and attribution
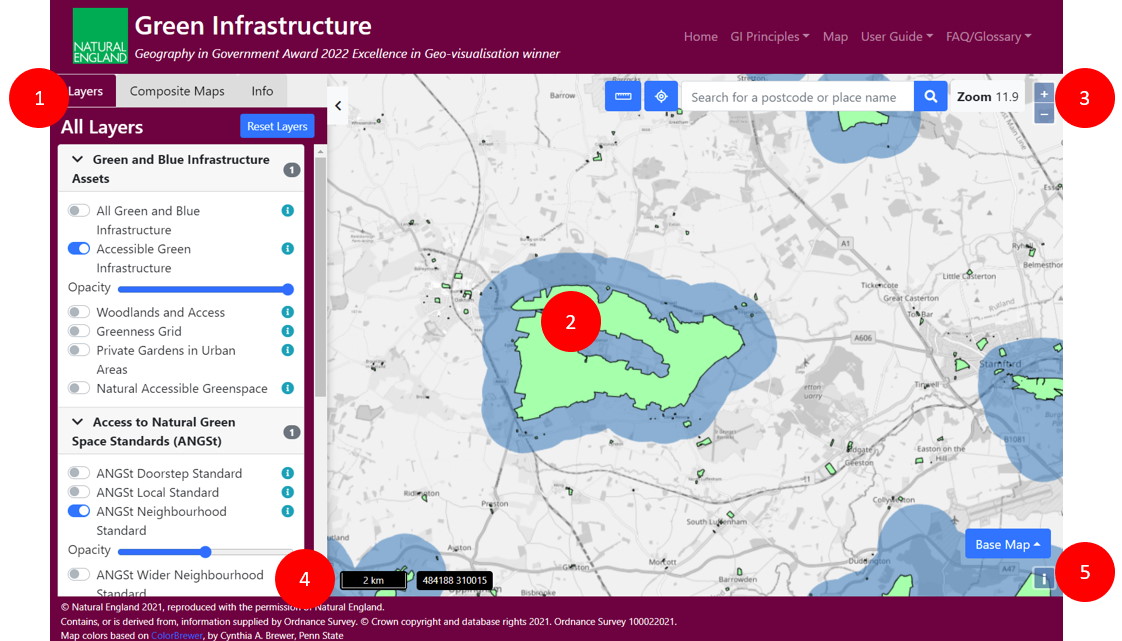
The Sidebar
Layers and thematic groups
The sidebar organises the GI layers into thematic groups
To make this manageable the groups can be expanded and collapsed to reveal the layers inside. Behind the scenes, these layers may be combining datasets or presenting different aspects of the same dataset using different colours, which I’ll show you later. You can make a useful map for your needs by switching on various layers. You switch layers on and off by clicking on the layer name. When you do this notice that the button on the left indicates the layer is on and the number of layers switched on in the group is indicated. This is to help you know which layers are switched on in collapsed groups When you switch on a layer you often get a legend, which shows what each colour means on the map.
If you have multiple layers switched on, they are stacked on top of each other. When you are viewing multiple layers on the map, it can be useful to adjust the opacity so you can see what’s underneath. This is done with the opacity slider.
Layer information
The i button gives a brief description of the data in the layer in a popup. There is more information in the data part of the user guide. Just click it and then click again to dismiss it.
Layer visibility
Notice for some layers when you switch them on. An eye icon appears. If you hover over it, it will tell you to zoom in to see the layer. This is mainly a performance consideration (turning this layer on would display many millions of features) but also the map would be unintelligible at this zoom level. We’re finding that for the larger datasets, zoom level 11 or higher gives a good balance between performance and readability.
Resetting the layers
If you want to switch all the layers off to create a new map from scratch, click the reset layers button at the top of the sidebar.
The Main Map View
Basic navigation
The main map view displays the layers you have switched on against a base map. You can use the mouse to pan the map by left-clicking and dragging the mouse. You can zoom in and out of the map using the mouse wheel
For people who do not wish to use a mouse, it is still possible to navigate the map. Press Alt+M to focus the map and then the cursor keys (← ↑ → ↓) to pan. Use + or - to zoom in and out.
As you move around the map it will load new data. As the data loads you may see a loading spinner for a brief period.
Selecting features on the map
To view information about features you see on the map click on them. Information for all of the features from all of the visible layers will be displayed in the Info panel of the sidebar. You can clear your selection by clicking the clear selection button or clicking elsewhere on the map.
The Toolbar
The toolbar at the top of the map provides a number of useful controls
The measuring tool
This measures length and area on the map. When it is enabled, you will be prompted to start drawing a line or area with the mouse. Do this by clicking on the map and double-clicking to finish your measurement. You can clear the measurements by clicking the clear measurement button and exit measurement mode by closing the measure tool using the x button.
Locate me
If you have given permission in your browsers to let the map know your location then you can click the locate me button to centre the map on your current location. A purple point with an indicator of accuracy will display briefly after panning the map.
Gazetteer
You can search the map for any English place names and postcodes. Type in the postcode or placename and hit enter or press the search button. If you have entered a valid postcode, the map will zoom to that location. If you have entered a placename you will be offered a list of results and you can select each in turn, centering the map as you do.
Zoom indicator and zoom buttons
Another way to zoom in and out of the map is using the + and - buttons in the toolbar. The zoom level is shown alongside them.
Scale and location
At the bottom left of the main map view is a scale bar and the location of the centre of the map in Ordnance Survey eastings and northings.
Base maps and attribution
The base map button provides a selection of base maps to display beneath the GI layers. You can choose between Open Street Map layers and Microsoft Bing Maps.
Information about the base map can be found by clicking on the attribution button.