Section 3 - Mapping module descriptions.
This section provides detailed technical descriptions of the content of the individual map layers as seen on the website.
The descriptions focus on providing information on five aspects to each layer (map).
- Version and date of the map.
- What the layer shows. An explanation of the data shown in the layer.
- What data was used. A list of the data used to create the layer.
- What the layer attributes are (attributes are the information attached to the polygons on the map).
- What the limitations of the layer are. Information on any known significant issues, omissions, gaps and limitations to the data used or resulting layer content.
Full technical descriptions of the content and how it was created of each module are to be found in the Version 2.2 Method Statement.
Statement on sources of error.
The England Green Infrastructure Mapping Database brings together a wide set of data and has required a whole range of assumptions, simplifications, combinations, interpretations and generalisations to create workable maps.
We cannot check the exact details for every land parcel on the map so what the map says can be at variance with the situation on the ground.
This underscores the importance of ground truthing and supplementation with local data (and knowledge) in order to create a more accurate local product when required.
When reviewing the content of the mapping it is important to be aware of sources of error. There are four principal sources of error in the mapping.
- Error in the source data that will have transferred into the maps.
- Error generated by the generalisations and assumptions that have had to be made to make the mapping practicable.
- Errors that have been generated by processing error or data corruptions.
- Error generated by time lag between change on the ground and importation of new data from the source.
Section 3.1 Module 1. Green Infrastructure Assets
3.1.1 Combined Green and Blue Infrastructure Assets layer (Asset Registry).
Version and date of layer.
This layer has been updated for V 2.2 and the map was finalised in March 2025.
What is this layer?
This map (map 1.1) is the core Green Infrastructure dataset that fuels several other assessments and maps. It brings together a wide suite of spatial datasets on Green Infrastructure assets into one map using an integrating Green Infrastructure Typology (see method statement). The map does not however map all land in England.
What data was used?
The map has been created using the following datasets;
- OS Open Greenspace.
- OS Open Map Local (Woodland, Surface Water, Rivers, Tidal Rivers, Tidal Waters).
- Natural England, Local Nature Reserves, Access Land (including Section 15), England Coast Path - Coastal Margin, Doorstep Greens, Millennium Greens, Country Parks.
- National Forest Inventory.
What are the layer attributes?
Attached to each Green Infrastructure polygon are attributes giving information about that specific polygon. The attributes are listed below.
Code = Green Infrastructure Typology Code.
Type = Green Infrastructure Typology Name.
Naturalness = Assigned rating 1 to 3 - see method statement.
Percent Manmade = Percent of polygon that is manmade surface (Not vegetation, water or soils). This attribute is derived from OS Mastermap Topography data. Please note that this data does not include any man-made surface within gardens.
Dataset = Original Input dataset
What are the limitations and caveats to content?
This layer does not categorise every land parcel in England and only those parts of England covered by the source data are provided with a Green Infrastructure Typology.
The accuracy of the data is that inherited from the source data. Reasonable effort has been made to ensure that the map accurately represents the input from the source data, but all source data will contain error and the existence of a polygon and its associated attributes on the map does not necessarily match circumstances on the ground. When using the map, ground truthing of the data will be required.
Because data is combined from multiple sources, polygons may overlap. Where this occurs the polygon visible will be that at the lowest level of the typology list but the outline of underlying polygons can be seen by clicking on the affected polygon.
All polygons present at any particular point are listed in the attribute information table that appears once the map is clicked on.
Please see the Method Statement for notes on the depiction of "Playing Fields" and the removal of isolated Cricket Pitches (new for V 2.2).
3.1.2 Accessible Green Infrastructure (AGI).
Version and Date of layer.
Version 2.2. This map was finalised in March 2025.
What is this layer?
This map (map 1.2) displays all Green Infrastructure assets that are thought likely to be publicly accessible greenspaces. Table 1 sets out those typologies treated as "publicly accessible". Spaces such as golf courses, allotments, sports facilities, private gardens are not included in Map 1.2.
In addition, polygons have been "dissolved" to remove the effect of overlaps so that each polygon represents the maximum extent of Accessible Green Infrastructure irrespective of overlapping typologies.
Definitions of accessible greenspace used in Version 2.2 of the Green Infrastructure mapping.
For the Green Infrastructure mapping, a simple hierarchy of accessibility was used based on the formality of access provision. The hierarchy has three levels.
- Publicly accessible. Likely to be open to the general public, free of charge (at least mostly) and a space where the public would expect to be able to access at least during daylight hours. This could either be via a formal public right of access (such as by designation as access land but not purely by the existence of a Public Right of Way over any land) or it being a space provided for public access as a core land use purpose (including for example public parks but also places such as cemeteries or public playing fields).
- Accessible to the public. Land to which public access is permitted by the landowner, usually free of charge (although some areas or facilities may be pay to access). Access may be restricted in extents, times of day or year and may be subject to closure at short notice or may come with conditions. Permissive access may also be removed by the landowner. A sub-category of "Accessible to the public" would be sites that charge for access. Such sites are not included in the mapping.
- Accessed by the public. Land that is accessed by the public but over which no right or permissive access arrangements are known. Such access may be tolerated by the landowner, be locally accessible by tradition, be incidental in nature or be actual trespass. Such sites are not included in the mapping.
The application of a typological approach to assess accessibility results in some errors for example; some cemeteries are private as are some "Playing Fields". The detailed determination of public accessibility can only be confirmed locally.
| Dataset | Attribute | Accessible | Used in AGSt |
|---|---|---|---|
| OS Greenspace | Allotments or Community Growing Spaces | No | No |
| OS Greenspace | Bowling Green | No | No |
| OS Greenspace | Cemetery | Yes | No |
| OS Greenspace | Golf Course | No | No |
| OS Greenspace | Other Sports Facility | No | No |
| OS Greenspace | Play Space | Yes | No |
| OS Greenspace | Playing Field (see V 2.2 Method Statement note on removal of isolated Cricket Pitches). | Yes | Buffer_200 only |
| OS Greenspace | Public Park or Garden | Yes | Yes |
| OS Greenspace | Religious Grounds | Yes | No |
| OS Greenspace | Tennis Court | No | No |
| Local Nature Reserve | None | Yes | Yes |
| Natural England open access data (including section 15) | None | Yes | Yes |
| England Coast Path and Margin | Coastal Margin | Yes | No |
| Millennium Greens | None | Yes | Yes |
| Country Parks | None | Yes | Yes |
| Doorstep Greens | None | Yes | Yes |
| OS Open Map Local | Woodland | No | No |
| National Forest Inventory | None | No | No |
| Ancient Woodland | None | No | No |
| OS Open Map Local | Canal | No | No |
| OS Open Map Local | Inland River | No | No |
| OS Open Map Local | Lake | No | No |
| OS Open Map Local | Tidal River | No | No |
| OS Open Map Local | Tidal Water | No | No |
Note on exceptions.
Some typologies considered not normally accessible were included as accessible if they formed part of a wider typology deemed accessible. For example, woodland has been classed as "not accessible" but included as accessible if it forms part of a public park. Likewise, Tennis Courts and Bowling Greens which on their own are deemed "not accessible" but are included as accessible if within a public park.
What data was used?
Data to identify Accessible Green Infrastructure was derived from Map 1.1
OS Mastermap "manmade surface" data was used to estimate the proportion of all Accessible Green Infrastructure polygons that are likely to be surfaces such as building footprints, car parks, paths and hard standings etc.
What are the layer attributes?
Area = Area of the polygon in hectares
What are the limitations and caveats to content?
Some polygons mapped as "publicly accessible" may in fact be permanently closed or private. The inclusion of a space on the Accessible Green Infrastructure Layer does not create any forms of public access.
Some accessible spaces are missing from the source data and will not appear on the maps.
Access Land and Coastal Margin are mapped as wholly accessible. However, in practice Access Land and Coastal Margin polygons will include "excepted land" that are excluded from access rights and will not be publicly accessible. Excepted land can be extensive if it involves large industrial or port facilities etc. In addition, Coastal Margin is not currently included in the Accessible Greenspace Standards Assessment.
There may be a range of spaces that are accessed by the public but to which formal access provision is either permissive, limited (formally limited to identified individuals, groups or residents etc), or may be tolerated or incidental or even trespass. These sites are not included in the Accessible Green Infrastructure data.
The existence of a polygon on this map does not create and is not evidence of any form of legal access.
3.1.3 Land with Permissive Access.
Version and date of layer.
Version 1.2. No additional data added for V 2.2, layer was created in Autumn 2022.
What is this layer?
This map (1.3) shows land that is accessed through a permissive agreement with the landowner. Land such as this can become inaccessible should the landowner revoke the land access agreement.
What data was used?
Incorporated into the Permissive access layer are the following data:
- Cheshire Wildlife Trust reserves public access
- Open Access Derbyshire Wildlife Trust Reserves
- Kent Wildlife Trust Reserves
- Essex Wildlife Trust Reserves with public access
- Berks, Bucks and Oxon Wildlife Trust (BBOWT) Accessible Nature Reserve Boundaries
- National Trust Open Data: Land - Always Open
What are the attributes?
The polygons include attributes for site name, land owner and size (in hectares).
What are the limitations and caveats to content?
This layer only contains data provided by the specified organisations who have come forward and agreed to provide data for this map. Although every effort was made to contact major landowners there are areas of England not covered by this data set.
3.1.4 Area of Accessible Green Infrastructure per 1000 people.
Version and data of layer.
Version 2.2. This map was completed in March 2025.
What is this layer?
This map (map 1.4) displays the total amount of "Accessible Green Infrastructure" per 1000 people (in square metres) at LNRS area, Local Authority, MSOA and LSOA level. Accessible Green Infrastructure was identified using the attribution approach set out in table 1.
What data was used?
This map uses the accessible greenspace polygons from the Combined Green and Blue Infrastructure layer in combination with the ONS LSOA population data (Census 21).
What are the attributes?
The attribute box displays;
- A location descriptor
- The total amount (Ha) of Accessible Green Infrastructure in each area;
- The amount of Accessible Green Infrastructure per 1000 population;
- A breakdown of the types of Accessible Green Infrastructure by categories (Publicly Accessible Greenspaces, Local Nature Reserves, Access Land and Coastal Margin). The "Publicly Accessible Greenspaces category is all AGI without Access Land and Coastal Margin.
What are the caveats and limitations to content?
This is a measure of accessible greenspace supply using the typologies identified as accessible in table 1. Accessible greenspaces that are missing from the data will generate an underestimate. Polygons that have been identified as accessible but that in reality are not will result in an over-estimate of amounts.
3.1.5 Local Authority area of AGI that is LNR.
Version and date of layer.
Version 2.2. This layer was created in March 2025 based on data from Map 1 (data imported autumn 2024).
What is this layer?
This map (Map 1.5) shows the amount of Accessible Green Infrastructure at Local Authority (lower tier) level that is designated Local Nature Reserve.
What data was used?
This map uses the Natural England LNR dataset as of September 2024.
What are the attributes?
- Area - Area of the Local Authority (km2)
- Population - as at Census 2021.
- Accessible Green Infrastructure - total amount of all AGI typologies (ha)
- AGI that is LNR - total area (ha).
- AGI area per 1000 population (ha).
What are the limitations and caveats to content?
Local Nature Reserves that were not in the data at the time the map was created will not be accounted.
Changes in LNR designation since September 2024 will not appear.
3.1.6 Woodlands and access.
Version and date of layer.
No substantial work to update the access to woodlands data has been done for V 2.1 pending the outcomes of work related to the England Woodlands Action Plan delivery (due 2025).
However, there were minor updates to this layer for V 2.1 and the map was finalised in March 2024. New woodlands data was imported in spring 2023 and the most up to date Public Rights of Way Network data (V 2.1) was imported in March 2024.
What is this layer?
This map (map 1.6) extracts woodland data from layer 1.1 and applies an initial sift for likely public accessibility (see method statement).
The assessment of access to woodlands is initial and limited. Woodlands were sifted on the basis of fulfilling one of three criteria to assign an accessible flag as either;
Accessible. Woodland is mapped as accessible if it is within an Accessible Green Infrastructure polygon on Map 1.2.Non-Accessible - All other woodland (this may include woodland that is accessible but for which access arrangements were unknown for the purposes of mapping in V 1.2).Linear Accessible - Woodland that is either crossed by a Public Right of Way or has one along at least part of its edge. For these woods a corridor of arbitrary width 20m (10 m either side) is depicted on the map that follows the line of the Public Right of Way. This identifies the likely presence of such a linear route that has a woodland character. The linear corridor does not imply or create access to any of the woodland except that along the route of the Public Right of Way.
What data was used?
The Woodlands and Access layer uses the following data:
- OS Open Map Local - Woodlands
- National Forest Inventory
- PRoW Network (Map 3.1)
- Accessible Green Infrastructure (Map 1.2)
What are the layer attributes?
Area = Extents of woodland in hectares.
Access type = Accessible, non-accessible or linear access corridor.
What are the limitations and caveats to content?
The assessment of accessibility only looks at whether a woodland polygon is accessible as a consequence of being a part of an accessible green space and/or contains a Public Right of Way (or has one along at least part of its edge).
Where the Public Rights of Way data is out of date and there have been changes to the Definitive Map, these will not show on the Woodlands and Access map. The local Definitive Map should be consulted to establish the legal route of any recognised Public Right of Way. The depiction of Public Rights of Way in the Green Infrastructure mapping neither creates nor affects the existence or location of the legal route.
Where Public Rights of Way data were not available, woodlands accessible by PRoW could not be mapped and any linear access corridors will not show up on the layer.
The layer does not contain any information on permissive or incidental access.
The inclusion of a woodland classed as accessible on the map does not create any right of access.
3.1.7 Greenness Grid.
Version and date of layer.
Version 2.1. This map was finalised in March 2023.
What is this layer?
This layer (map 1.7) provides a 250m square grid assessment of the percent "manmade surface" (not vegetation, water or soils) within the grid squares covering all England. The grid is aligned with the OS National Grid.
What data was used?
The "manmade surface" was derived from manmade surface data within the topography layer from Ordnance Survey's (OS) 'Master Map' data.
What are the layer attributes?
The grid squares come with simple attribute data on percent of the grid square that is "manmade surface" (not vegetation, water or soils).
What are the limitations and caveats to content?
Greenness is expressed as "percent manmade surface" but is infact the inverse of that measure. However, there are difficulties in measuring total greenness without being able to include things such as tree canopy or small green features such as street planters, green walls etc. In urban areas, this will impact on this measure of greenness as the presence of urban trees introduces a canopy level greenness not represented in the OS Topography layer source data.
In addition, the totals for man-made surface do not include any estimate for the amount of garden space that is non-vegetated. Gardens are excluded from the Greenness Grid because their surfaces are characterised as "mixed" and undifferentiated. The Greenness Grid thus represents the ambient greenness of the grid square outside of gardens.
Note that the current Greenness Grid differs from that published in V 1.2 as previous iterations contained an alignment error which means that individual grid squares cannot be compared between versions.
The Urban Habitat Mapping Grid also aligns with the Greenness Grid and provides some further data on the likely major urban habitats contained within the grid square.
The OS data assigns a "natural" classification to all water irrespective of whether the water body itself is man-made or heavily modified.
3.1.8 Greenness in Urban Residential Neighbourhoods.
This layer is in preparation and not included in V 2.2.
3.1.9 Known Access Points to Accessible Green Infrastructure.
Version and date of layer.
Version 2.1. This map was finalised in March 2024.
What is this layer?
This layer (map 1.9) provides point data information on the location of designated or official points of access to Accessible Green Infrastructure.
What data was used?
OS Access Points were extracted from the OS Open Greenspace Data.
Access points to Access Land were generated by locating the points where the edge of Access Land polygons was crossed by 1 or more Public Rights of Way.
Greenspaces without access points represent those for which no data was found. A lack of access points may indicate the space has an unrestricted boundary or conversely may in fact by private.
What are the attributes of this layer?
The attributes provide information on the "type of access" and "mode of accessibility" (who would normally use the access point).
The "types" of access are:
- Path (this may be a Public Footpath or other designated access path to a greenspace).
- Bridleway.
- Byway Open to All Traffic
- Restricted Byway.
- Track.
- The modes of access are (these may be listed in combination as an access point may be designated for more than one mode of access);
- Pedestrian.
- Cycle.
- Horse.
- Motor vehicle.
What are the limitations and caveats to content?
Some access points may be missing from the data.
Access Points shown for "Access Land" are assumed when there is an intersection between the polygon edge for Access Land and a Public Right of Way that crosses it. There may be other official access points off roads and tracks etc that are not marked. No national dataset of all access points to Access Land exists.
Some access points within broader greenspaces may be the designated access points to specific facilities within the greenspace such as sports or play provision.
Polygons without access points may either have unrestricted edges or may conversely be private.
3.1.10 Blue Infrastructure Access Points.
This layer is in preparation and not included in V 2.2.
3.1.11 Private Gardens per 1000 people.
Version and data of layer.
Version 2.1. This map was finalised in March 2023.
What is this layer?
This layer (Map 1.11) displays the amount of private garden space per 1000 people at LSOA level across all England (previous versions of this map were for urban areas only). The LSOA are coded by decile of number of records for the amount of garden space within the LSOA area (each decile thus representing a 10% slice of the total number of LSOA in England).
What data was used?
This layer is derived from the OS Mastermap data (Gardens extract). Please note that the Gardens Map in V 1.2 was derived from the OS Greenspace non open dataset which was urban only. The V 2.1 Gardens map covers all England (thus including rural areas) and is derived directly from OS Mastermap and may thus not quite tally with the previous version.
What are the attributes?
The attribute box simply displays a location descriptor (name of LSOA) alongside the total amount (Ha) of Private Garden Space (from the OS data) in each LSOA and the amounts (square metres) of garden space per 1000 population. The data is depicted in colour coded deciles (by number of records not equal interval).
What are the caveats and limitations to content?
The data includes garden space that is buildings or other man-made or sealed surface. Gardens that are associated with developments that were not represented in the OS data will not be recorded.
Section 3.2 Module 2. Accessible Greenspace Standards (AGSt) Assessment for England
This module is a full Access to Greenspace Standards assessment for England.
The assessment was undertaken using a subset of the data for map 1.1 (see list of typologies used for the assessment set out in Table 1) and utilised a system of six Accessible Greenspace Standards (AGSt) as set out in table 2 below.
In the England Green Infrastructure mapping greenspace 'accessibility' is measured by creating buffers of set width around greenspaces to create "zones of proximity". Actual distances from home to greenspace may be longer than the buffer width.
In addition, wider aspects of accessibility such as those set out in the Disability Discrimination Act (1995) are not included in the mapping.
Defra have now published some initial data for the Access to Nature Official Statistic in development that looks at percent households within 15 minutes network walking distance of an access point to a "greenspace". Some initial maps of this data for greenspace scenarios that most closely relate to the Doorstep, Local, Neighbourhood and Combined Buffers is presented in module 7. These maps can be used in combination with the AGSt Buffers to allow a more detailed understanding of distance based accessibility at Output Area level.
| Name of AGSt criterion | Size distance criteria |
|---|---|
| Doorstep Greenspace | At least 0.5 ha within 200 metres |
| Local Greenspace | At least 2 ha within 300 m |
| Neighbourhood Greenspace | 10 ha within 1 km |
| Wider Neighbourhood Greenspace | At least 20ha within 2km |
| District Greenspace | 100 ha within 5 km |
| Sub-regional Greenspace | 500 ha within 10 km |
| Local Nature Reserves (LNRs) | LNRs of at least 1 ha per 1000 population |
Caveats and limitations to content.
The Accessible Greenspace Standards Assessment uses the greenspaces in Map 1.1 and filtered as set out in Table 1. Polygons were dissolved to create a single feature to avoid distortions that could be created if polygons overlapped (as they do on map 1.1). The area of each resulting polygon was calculated to determine the size of the buffer that should be created around them based on the standards set out in the table 2.
Version 2.2 retains the use of a "Straight Line Buffer" method to delineate buffers that should be considered "zones of proximity" to associated greenspaces.
No corrections are included to understand the impact of major barriers (such as motorways, railways or rivers etc) on local buffers. More detailed assessment would understand the impact of major barriers on buffers and the impact of existing bridging points on network analysis.
However, map 2.8 identifies the route of major barriers of all railways and motorways in England. Used as an overlay to the AGSt Buffer maps, these can be used to detect where significant barriers may disrupt access routes across the buffer area. This layer was updated for V 2.1 and was finalised in March 2024.
When used in association with the Blue Infrastructure Network layer (map 5.1) the potential existence of barriers created by water courses can also be detected.
Polygons under 0.5 ha were not included in the AGSt analysis.
The Accessible Greenspace Buffers layers (maps 2.1 to 2.6).
Version and layer date.
V 2.2. These maps were finalised in March 2025 (OS data downloaded September 2024).
3.2.1 AGSt Doorstep Standard.
This map (map 2.1) presents the Doorstep AGSt assessment (A greenspace of at least 0.5 ha within 200m). Buffers of 200m have been created around all "Natural Greenspaces and Playing Fields" bigger than 0.5 ha (see method statement). The incorporation of Playing Fields is unique to the 200m buffer and results in a more general Accessible Greenspace measure for this most local level of AGSt assessment.
The buffers generated for the remaining Accessible Greenspace Standards do not include Playing Fields.
3.2.2 AGSt Local Standard.
This map (map 2.2) presents the Local AGSt assessment (A greenspace of at least 2 ha within 300m). Buffers of 300m have been created around all included greenspaces of at least 2 ha in size.
3.2.3 AGSt Neighbourhood Standard.
This map (map 2.3) presents the Neighbourhood AGSt assessment (A greenspace of at least 10 ha within 1 km). Buffers of 1 km have been created around all included greenspaces of at least 10 ha in size.
3.2.4 AGSt Wider Neighbourhood Standard.
This map (map 2.4) presents the Wider Neighbourhood AGSt assessment (A green space of at least 20 ha within 2 km). Buffers of 2 km have been created around all included greenspaces of at least 20 ha in size.
3.2.5 AGSt District Standard.
This map (map 2.5) presents the District ANSt assessment (A greenspace of at least 100 ha within 5 km). Buffers of 5 km have been created around all included greenspaces of at least 100 ha in size.
3.2.6 AGSt Sub-Regional Standard.
This map (map 2.6) presents the Sub-Regional AGSt assessment (A greenspace of at least 500 ha within 10 km). Buffers of 10 km have been created around all included greenspaces of at least 500 ha in size.
3.2.7 AGSt Profile.
What is this layer?
This map (map 2.7) brings together the full set of AGSt assessments into one "combined buffer" map to allow an understanding of the AGSt Profile of buffers covered for any given location. This gives some indication of which AGSt Standards are likely to be met at any given location, although network analysis may be required to confirm detail at local level.
What data was used?
This layer was generated by bringing together the single buffer layers for maps 2.1 to 2.6
What are the attributes of this layer?
This map has no attributes.
What are the limitations and caveats to content?
This layer provides information on the range of different AGSt Standards that are likely to be met at any selected location. It does not however provide information on how significant the meeting of any benchmark is at any given location. Such significance will be affected by a range of variables (including presence or absence of population) that will require local determination to understand whether the AGSt profile for any given location is or is not likely to be meeting the greenspace proximity needs of that location.
3.2.8 Major Barriers layer.
Version and layer date.
Version 2.1. Source data was imported March 2024.
What is this layer?
This layer (map 2.8) presents information on major linear features that may be significant barriers to accessing greenspaces.
This layer may be overlain over the Accessible Greenspace buffers layers (maps 2.1 to 2.6 or 2.7) to identify places where such barriers may restrict or even prevent movement across the buffer area thus restricting the actual greenspace catchment. The access points layer (map 1.9) may also be used to help understand the spatial relationships between green spaces, barriers and access points.
In addition, the Blue Infrastructure Network map (map 5.1) can also be used to identify watercourses that may be operating as barriers in addition to the railways and motorway routes included in map 2.8 alone.
Information on bridging points is not included and may require local addition.
What data was used?
The layer was generated by extracting information on the railway and motorway network for England from Ordnance Survey Open Map Local.
What are the attributes for this layer?
The layer only includes very simple attributes identifying a depicted feature as either a railway or motorway.
What are the limitations and caveats to content?
The layer only shows the route of railways and motorways. No bridges are shown which may mitigate for the barrier effect of these features.
The layer does not specifically include water courses as these are identifiable using the Blue Infrastructure Network map (map 5.1) in associated with Major Barriers.
Section 3.3 Module 3. Linear Access
This module presents information about linear access rights (Public Rights of Way - PRoW).
Note on data accuracy. Data for this module has been collated from many Highways Authorities. The data sourced was the most up to date available at the time of collation (between autumn 2023 and spring 2024). However, the date of the data in available downloads may in practice be several years older than when collated and the data included in this module should thus be treated with some caution. If up to date data is required, it should be sourced directly from the relevant Highways Authority.
3.3.1 - The Public Rights of Way (PRoW) Network Map.
Version and layer date.
Version 2.1. This layer was finalised in March 2024. This module was not updated for V 2.2.
What is this layer?
This layer (map 3.1) is a compilation of data from Local Highway Authorities of their Public Rights of Way networks. Highway Authorities have provided digital data derived from their Definitive Maps (which are the legal document recording the routes of known Public Rights of Way). Map 3.1 is not a Definitive Map and nor is the digital source data. The depiction of a route on map 3.1 does not create, vary or extinguish the route of any Public Right of Way. The most up to date data on the Public Rights of Way for any Highway Authority will be that held by the authority on its Definitive Map which should be consulted to establish the legal route and status if required.
Please note that not all authorities have published data in digital form. Some authorities are exempt from maintaining a Definitive Map and no data for these areas could be included. Some authorities have published data in "raster" image form which could not be incorporated with the digital data from which map 3.1 is derived. It is also possible that some authorities only maintain Public Rights of Way data in paper form as the Definitive Map. These latter areas are also missing from map 3.1.
What data was used?
Data was sourced from Local Highway Authorities via download from their website or as provided to Natural England directly. Map 3.1 was finalised in February 2024. Any changes to Definitive Maps since then will not be represented in map 3.1.
For V 1.1 data could not be sourced for 53 Highway Authorities. For Version 1.2 data had been sourced from an additional 6 Highway Authorities. For V 2.1 further data from another 7 Highway Authorities has been sourced meaning data from 41 authorities could not be imported.
Those authorities for which data could not be sourced are listed below in table 3. Please note that this includes Inner London authorities and the Isles of Scilly that are not required to produce Definitive Maps.
The data provided by Highway Authorities on their rights of way network is based on their individual Definitive Maps. However, the published data does not constitute or amend the Definitive Map itself and the representation or omission in the data of any right of way does not constitute evidence of any legal status of any route.
To establish the legal status or accurate and up to date route of any right of way in any Local Authority area, it is the respective Definitive Map that should be consulted.
What are the attributes?
Name = Unique route identification code provided by the source data.
Type = The type/status of the Public Right of Way. These can be:
- Public footpaths.
- Bridleways.
- Byways open to all traffic.
- Restricted Byways.
- No category recorded = where no information was provided.
What are the limitations and caveats to content?
See note on data accuracy above.
Data for the PRoW Network map could not be sourced for 41 Highway Authority areas which are listed in Table 3. However, the 13 Statutory Inner London Authorities (including City of London) and the Isles of Scilly do not maintain Definitive Maps and for which there is therefore no data. This leaves 27 Highway Authorities for which data probably exists but could not be accessed to include in V 2.1 of the mapping.
| Local Authority code | Local Authority Name |
| E06000002 | Middlesbrough |
| E06000006 | Halton |
| E06000012 | North East Lincolnshire |
| E06000020 | Telford and Wrekin |
| E06000030 | Swindon |
| E06000032 | Luton |
| E06000033 | Southend-on-Sea |
| E06000053 | Isles of Scilly |
| E08000012 | Liverpool |
| E08000021 | Newcastle upon Tyne |
| E08000022 | North Tyneside |
| E08000024 | Sunderland |
| E08000028 | Sandwell |
| E08000031 | Wolverhampton |
| E09000001 | City of London (IL) |
| E09000002 | Barking and Dagenham |
| E09000003 | Barnet |
| E09000019 | Islington (IL) |
| E09000007 | Camden (IL) |
| E09000008 | Croydon |
| E09000010 | Enfield |
| E09000011 | Greenwich (IL) |
| E09000012 | Hackney (IL) |
| E09000013 | Hammersmith and Fulham (IL) |
| E09000014 | Haringey |
| E09000015 | Harrow |
| E09000017 | Hillingdon |
| E09000018 | Hounslow |
| E09000020 | Kensington and Chelsea (IL) |
| E09000033 | Westminster (IL) |
| E09000021 | Kingston upon Thames |
| E09000022 | Lambeth (IL) |
| E09000023 | Lewisham (IL) |
| E09000024 | Merton |
| E09000025 | Newham |
| E09000026 | Redbridge |
| E09000028 | Southwark (IL) |
| E09000029 | Sutton |
| E09000030 | Tower Hamlets (IL) |
| E09000031 | Waltham Forest |
| E09000032 | Wandsworth (IL) |
3.3.2 - Public Rights of Way Density Map (Expanded coverage for V 2.1).
Version and date of layer.
Version 2.1. This map was finalised in March 2024.
What is this layer?
This layer (map 3.2) uses a 1 km grid (aligned with the OS Grid) to assess the density of Public Rights of way (of all classes) based on the measure "km length of PRoW per square km". Please note that not all grid squares are covered as data may not be available. Where this is so, the squares have been removed, showing the base map.
A 1 km grid covering whole of England, in alignment with the 250 m grid (and thus the OS grid) was used.
Each grid square was assigned a decile rank using a system by number of records. The length intervals are thus not equal interval. This approach avoids the impact of the relatively small number of "outliers" that have very high density (in decile 10) on the more common levels for most grid squares. Each decile thus sets out the density range for 10% of the total number of grid squares.
Calculations were made for all PRoW and each PRoW type (footpath, bridleway etc.) as well as total length. The lengths of National Trail and (where designated at time of map 3.2 production - March 2024) Coastal Trail have been included in the grid square statistics but are not part of the density equation (to avoid double counting).
Where no PRoW data was available from a Highway Authority the original boundary polygon for that authority was used to erase the area from the density grid. The squares are removed showing the base map.
What data was used?
Data compiled for map 3.1 was used.
What are the attributes?
Each grid square has the following attributes in metres:
- Total length of all Public Rights of Way.
- Total length of Public Footpath.
- Total length of Bridleway.
- Total length of Byways Open to All Traffic.
- Total length of Restricted Byway.
- Total length of National Trail.
- Total length of designated Coastal Trail (up to February 2024).
- No category where PRoW status is uncertain.
What are the limitations and caveats to content?
Unless also mapped as a Public Right of Way (such as Bridleway or Byway) designated cycleways are not included in Version 2.1 of the mapping.
Data for the PRoW Network map could not be sourced for all Highway Authority areas (see layer 3.1), this has resulted in there being grid squares for which there is no current data. These are identified as block grey in colour.
Some grid squares along boundaries of authorities for which there is no data are subject to edge effect statistical distortions.
No permissive access routes are included in the PRoW mapping.
3.3.3 Higher Rights Network Map.
Version and date of layer.
Version 2.1. This map was finalised in March 2024.
What is this layer?
This layer (map 3.3) extracts data on so called "higher rights" from map 3.1 (PRoW Network Map). Map 3 includes data for Public Bridleways, Byways Open to All Traffic (BOATS) and Restricted Byways only. In other words map 3.3 does not include Public Footpaths.
The map is intended to show PRoW routes available for at least walking, cycling and horse riding.
What data was used?
Data for map 3.3 was extracted from map 3.1
What are the attributes?
Route sections include attribute data for the unique route name, status (Bridleway etc) and length of route segment (in metres).
What are the limitations and caveats to content?
Unless also mapped as a Public Right of Way (such as Bridleway or Byway) designated cycleways are not included in Version 2.1 of the mapping.
Data for the PRoW Network map could not be sourced for all Highway Authority areas (see layer 3.1), this has resulted in there being gaps on the map for which data is not available.
No permissive access routes are included in the PRoW mapping.
3.3.4 Higher Rights Density.
Version and date of layer.
Version 2.1. This map was finalised in March 2024.
What is this layer?
This layer (map 3.4) uses a 1 km square grid (aligned with the OS Grid) to assess the density of "Higher Rights" Public Rights of way based on the measure "km length of "Higher Rights" PRoW per square km". Please note that not all grid squares are covered as data may not be available. Where this is so, the squares have been removed, showing the base map. Public Rights of Way (PRoW) network data (from map 3.1) was used for map 3.4. PRoW that were classed as Public Footpath were removed and the density of remaining PRoW within each 1 km grid square was assessed by measuring the length of each residual PRoW type per 1 km grid square.
Calculations made relate to lengths of Bridleway, Byway Open to All Traffic and Restricted Byway only.
Where no PRoW data was available from a Highway Authority the original boundary polygon for that authority was used to erase the area from the density grid. The squares are removed showing the base map.
Please note that the version of this map in V 1.2 used a 5 km grid system. For V 2.1 this has been reduced to a 1 km grid system to be more in line with map 3.3.
What data was used?
Data for map 3.4 was extracted from map 3.1 (PRoW Network) by removing routes with a Public Footpath status.
What are the attributes?
The attributes for this map give information on which decile the grid square is, total length of Higher PRoW and length by PRoW class.
What are the limitations and caveats to content?
Unless also mapped as a Public Right of Way (such as Bridleway or Byway) designated cycleways are not included in Version 2.1 of the mapping.
Data for the PRoW Network map could not (on this occasion) be sourced for all Highway Authority areas (see layer 3.1), this has resulted in there being grid squares for which there is no current data. These areas are removed from the map.
No permissive access routes are included in the PRoW mapping.
3.3.5 Public Rights of Way Experiential Terrain Mapping.
Version and date of layer.
Version 1.2. This map was finalised in January 2023. Both the PRoW network and Living England Map data have been updated since, but changes to these source data will not be represented in this map version.
What is this layer?
This layer (map 3.5) provides information on the probable physical experience likely to be encountered along the route of Public Rights of Way.
The physical experience is defined by two parameters.
- Parameter one. Likely ground cover conditions based on the Living England Habitat Probability data.
- Parameter two. Physical and topographic terrain likely to be experienced based on Landscape Description Unit data.
The data seeks to provide information on the probable ground conditions of a route and set that within the context of the physical geography of a given route.
What data was used?
The PRoW experiential Terrain mapping (map 3.5) was created using the following data:
- Map 3.1. Public Rights of Way Network Map.
- Living England Habitat Probability Mapping. Living England Habitat Map (Phase 4)
- Landscape Descriptor Unit data. This data is held by Natural England but is not Open Government Licensed. Data is incorporated as a derived product.
- Moorland Line. Moorland Line
What are the attributes?
Attributes provided are:
- Public Rights of Way class.
- Terrain Class (Aggregated Living England Habitat Probability - see Method Statement).
- Landform description.
- Physical description. This attribute relates to the underlying geology of the area in question. The classes provided by the data are; Soft (Mesozoic) rocks; Hard (Caledonian) rocks; Glacial lowlands; Fluvial lowlands; High Hills (above 300m)
- Route section length.
What are the limitations and caveats to content?
Data for Public Rights of Way (PRoW) could not be sourced for all local authorities. A list of Local Authorities where data could not be sourced can be found in section 3.3.1
Updates to local authority definitive maps that take place after map 3.5 was created will not be incorporated.
Living England is a habitat probability map created using machine learning. The habitat probability map displays modelled likely broad habitat classifications trained on earth observation data from 2021 as well as historic data layers. The Living England data should not be seen as a definitive habitat survey.
3.3.6 National Cycle Network.
Version and date of layer.
Version 2.1. This map was finalised in March 2024.
What is this layer?
The National Cycle Network is the flagship dataset of Sustrans, the walking, wheeling and cycling charity.
The Network displays signed on-road and traffic free cycle routes across the UK.
The UK network contains over 12,000 miles of signed paths and routes for walking and cycling.
5000 of these routes are traffic free, with the remainder of the network using previously existing minor roads.
What data was used?
The data used was the Sustrans National Cycle Network open data download.
What are the attributes.
There are 5 attributes:
- Description - Whether the route is traffic free or on road.
- Route Type - The cycle network classification the route falls under.
- Route category (RouteCat) - Whether it is the main or alternative route or a Temporary diversion.
- Quality - The surface type and quality of the route.
- Lighting - How well lit the route is.
What are the limitations and caveats to content?
Please refer to the Sustrans open data portal for the most up to date of the NCN.
Natural England takes no responsibility for the data contained therein.
Sustrans receives updates from regional staff and volunteers on a continuous basis but cannot guarantee the data free from error. If you discover an error please inform Sustrans by contacting the GIS team - gissupport@sustrans.org.uk
Other (non-NCN) cycle or promoted routes are not included in this map. Natural England are open to receiving data on such routes for future potential inclusion on this map.
Section 3.4 Module 4. National Character Areas Statistics
This module presents data on Accessible Green Infrastructure, Private Garden space and Likely Accessible Waterside by National Character Area.
3.4.1 - Accessible Green Infrastructure in NCAs.
Version and date of layer.
Version 2.2. This layer was finalised in March 2025.
What is this Map?
This map depicts the percentage of the NCAs that are Accessible Green Infrastructure (all typologies combined).
What data was used?
Data from map 1 (Combined Green and Blue Infrastructure Assets).
What are the attributes?
- NCA name.
- NCA area.
The remaining attributes split the total Accessible Green Infrastructure into 4 separate categories to allow the identification of the relative mix of AGI types within the NCA.
Amounts and percentage of NCA that is:
- Accessible Green Infrastructure that is Access Land (including Section 15).
- Accessible Green Infrastructure that is Coastal Margin.
- Accessible Green Infrastructure that is Public Parks and Greenspaces (excluding Access Land and Coastal Margin).
- Accessible Green Infrastructure that is Local Nature Reserve.
What are the limitations and caveats to content.
Accessible Green Infrastructure is identified from the data that feeds into map 1. Errors in the source data will have translated into this map.
3.4.2 - Private Gardens in NCAs.
Version and date of layer.
Version 2.1. This layer was finalised in March 2024.
What is this layer?
This map depicts the amount (by percentage) of the NCA that is private garden space.
What data was used?
The data for this map was derived from the OS Mastermap Gardens data.
What are the attributes?
- Name of NCA.
- Area of NCA.
- Amount and percentage of NCA that is private garden space.
What are the limitations and caveats to content.
The accuracy of the data will be that inherited from OS Mastermap.
3.4.3 - Likely Accessible Waterside in NCAs.
Version and date of layer.
Version 2.2. This layer was finalised in March 2025.
What is this map?
This map depicts the percentage of total waterside within the NCA that is Likely Accessible Waterside.
What data was used.
Data was derived from map 5.3 (All Likely Accessible Waterside).
What are the attributes?
- NCA name.
- NCA area.
- Total length of waterside within the NCA.
- Total length and percentage of total waterside that is Likely Accessible.
What are the limitations and caveats to content.
The limitations inherited from the source data source data.
Errors in the depiction of waterside as "Likely Accessible" may arise due to errors in the Likely Accessible Waterside methodology that is set out in section 3.5.3.
Section 3.5 Module 5. Blue Infrastructure
This module concerns terrestrial water courses and water bodies (including Tidal) and presents an Access to Waterside Assessment.
3.5.1 - Blue Infrastructure Network (Surface water bodies, Surface line and tidal).
Version and date of layer.
Version 2.2. This map was finalised in March 2025.
What is this layer?
This layer (map 5.1) presents the full terrestrial Blue Infrastructure Network map excluding coastal waters. It brings together surface water bodies and line data with tidal water bodies.
What data was used?
The Blue Infrastructure Network map was created by combining data from three datasets:
- Ordnance Survey OpenMap Local Surface Water Area.
- Ordnance Survey OpenMap Local Surface Water Line.
- Ordnance Survey OpenMap Local Tidal Water.
What are the attributes?
The attribute box simply identifies to source data.
What are the limitations and caveats to content?
Whilst some more detailed data on surface water exists in the OS MasterMap Topographic Area - Surface Water dataset, this data set is not available as open data and is thus not included. This means some of the smaller water bodies will not appear on this layer.
3.5.2 - Inland Waterside Distribution Maps.
Version and date of layer.
Version 2.2. This map was finalised in March 2025.
This layer (map 5.2) displays the location of "waterside" extracted from Layer 5.1 source data that was used to undertake the Access to Waterside Assessment and is purely for reference.
3.5.3 - All likely accessible waterside.
Version and date of layer.
Version 2.2. This map (map 5.3) was finalised in March 2025 and uses the Public Rights of Way data from V 2.1.
What is this layer?
This layer (map 5.3) uses map 5.2 data to identify the location of watersides thought likely to be publicly accessible. Waterside is mapped as probably accessible if it occurs within proximity of specified access infrastructure and has not been subject to confirmation on the ground.
Waterside has been mapped as likely accessible if:
- The waterside is within 10m of the route of a Public Right of Way.
- The waterside is either contained within or within 1m of the boundary (and therefore adjacent) of a Publicly Accessible Greenspace.
- Within 10m of the route of an "Urban Path" as contained in the OS Mastermap dataset (urban areas only).
Map layers showing likely accessible waterside by proximity to a Public Right of Way or Accessible Green Infrastructure are also shown so that waterside in proximity to Urban Paths can be distinguished in the main layer.
Coastal access is not included in this assessment but forms part of the Coast and Access Module.
What data was used?
The Ordnance Survey (OS) OpenMap Local Surface Water (polygon and line) and Tidal Water (polygon) datasets were used to define the Blue Infrastructure (BI) to which access is measured. This includes rivers, streams, lakes, reservoirs, canals and tidal waters.
Four datasets were used to produce map 5.3:
- The Waterside (map 5.2) which is derived from map 5.1.
- The Accessible Green Infrastructure map 1.2.
- The Public Rights of Way Network map 3.1.
- OS Paths data extracted from OS Mastermap Highways - Paths. This is a non OGL dataset.
Note on incorporation of Urban Paths data.
Because urban areas have lower incidence of Public Rights of Way (as opposed to paths and streets etc) there is a significant underestimation of Likely Accessible Waterside within built up areas. In order to better represent urban waterside that is likely accessible, Urban Paths data was used within a defined Urban Mapping Domain of LSOA that were classified by the ONS (Rural Urban Classifications 2011) as Urban Major Conurbation, Urban Minor Conurbation or Urban City and Town.
Please note that updated ONS Rural Urban Classifications were published in March 2025 but are not used in this assessment.
What are the attributes?
The attribute box simply identifies the depicted waterside as likely to be accessible either by PRoW and/or Accessible Green Infrastructure and/or Urban Path.
What are the limitations and caveats to content?
The access to waterside assessment only maps the likelihood that the edges of water bodies and courses are accessible. The accessibility is inferred purely by proximity of water edge to Accessible Green Infrastructure, a Public Right of Way or Urban Path. Circumstances on the ground might mean that some sections marked as likely to be accessible are in fact not. The identification of waterside as accessible is thus only indicative.
The access to waterside maps do not consider any access to the actual water body itself and the existence of accessible waterside does not create or imply any such rights of access to the water for any purpose.
Waterside access created by permissive agreement or arrangements are not included in this assessment.
Accessible Green Infrastructure that is missing from map 1.2 will not be accounted for which may result in an under-estimation of accessible waterside.
OS Paths data identifies urban paths that are likely to be publicly accessible, but some may not be.
Access to waterside created by proximity to roads, pavements, bridges (unless they are for PRoW) and public realm (such as boulevards, shopping centres and promenades etc) is not represented in the mapping. This may result in an under representation of accessible urban waterside.
Because the assessment method uses a 10m buffer around urban paths to assess likelihood of accessibility, both sides of narrow water courses may be picked up as accessible even if only one side is aligned with the path. Thus, some waterside assigned "accessible" will in fact not be physically accessible. This will over-estimate likely accessible waterside.
Waterside may weave in and out of the buffers used which can lead to sections of one continuous waterside path being mapped as accessible and then not accessible in turn. This effect is called "weaving". In such cases, the actual waterside may in fact be continuously accessible.
3.5.4 - Waterside likely accessible by PRoW proximity.
This map merely extracts likely accessible waterside within 10m of a Public Right of Way.
3.5.5 - Waterside likely accessible by Accessible GI proximity.
This map merely extracts likely accessible waterside within the area of, or within 1m of an area of Accessible Green Infrastructure.
3.5.6 - Water Quality (WFD Biological).
Version and date of layer.
Version 1.2. Map finalised autumn 2022.
What is this layer?
This layer (map 5.6) presents water quality data using WFD Biological Water Quality data.
The layer uses WFD ecological status 2019 (for river, lake, canal and water bodies) as a general descriptor of Blue Infrastructure (BI) water quality across England. This was because WFD ecological status is the most comprehensive dataset on water quality and considered to be probably the best overall indicator of water quality,
What data was used?
Map 5.6 uses the Environment Agency WFD Ecological Status 2019 data.
What are the attributes?
The attribute box identifies type of water body, it's name and the WFD Biological Quality Class.
What are the limitations and caveats to content?
Limitations include the fact that it does not include smaller water bodies, monitoring frequency varies for water bodies, the range of parameters measured varies for water bodies.
3.5.7 - Waterside Statistical Maps.
Version and date created.
Version 2.2. Map finalised in March 2025.
What is this layer?
This map (map 5.7) presents statistical data on accessible waterside at Local Nature Recovery Strategy Area, Local Authority (Lower Tier), MSOA and LSOA levels.
LSOA and MSOA used are Census 2021.
The statistics include all waterside that is likely accessible from Accessible Green Infrastructure, Public Rights of Way or Urban Paths.
What are the attributes?
The data is presented at multiple scales. For each scale the attributes are:
- A location name / identifier.
- Total waterside in metres.
- Total waterside that is likely to be accessible (Urban Path, PRoW and Accessible GI proximity) in metres.
- Percentage of total waterside that is likely accessible.
What are the limitations and caveats to content?
See limitations set out in section 3.5.3.
3.5.8 Flood risk from rivers and seas.
Version and date of layer.
Version 1.2. Map finalised Autumn 2022.
What is this layer?
This layer (map 5.8) is a flood risk zone reference layer showing places identified as at risk from flooding by rivers and seas.
What data was used?
This map uses the Environment Agency Risk of flooding from Rivers and Seas "Flood risk from rivers and seas data (August 2022).
What are the attributes?
Each identified area of flood risk is assigned a risk level in the data used. These are replicated in map 5.8
What are the limitations and caveats to content?
Data is based on modelling undertaken by the Environment Agency.
3.5.9 Flood risk from surface water.
Version and date of layer.
Version 1.2. Map finalised Autumn 2022.
What is this layer?
This layer (map 5.9) is a flood risk zone reference layer and uses Environment Agency Risk of Flooding from Surface water extent: 3.3 percent annual chance Surface Water Flood Risk (1 in 30 year) data.
What data was used?
The Environment Agency Surface Water Flood Risk dataset was used (August 2022).
What are the attributes?
No specific attributes have been added.
Section 3.6 Module 6. Coast and Access
This module presents information on the England Coast and coastal access.
3.6.1 Designated Bathing Water.
Version and date of layer.
V 2.2. This layer was uploaded in June 2025.
What is this layer?
This layer (map 6.1) uses point data for the location of places that are designated Bathing Beaches or Bathing waters (inland).
The data used is "point source" and for the map an arbitrary 1km wide buffer around it has been created to improve visibility
Bathing Beaches / waters are not treated as green spaces as such and no actual AGSt style analysis has been attempted for them.
It should be noted that many of the beaches will have physical extents beyond the 1 km point buffer.
What data was used?
Environment Agency Bathing Water data (2023).
What are the attributes?
There are 3 attributes:
- Date (year) the beach / water was designated.
- Local Authority District.
- Local Sewerage Undertaker.
What are limitations and caveats to content?
The 1 km point buffer is purely arbitrary and designed to emphasise the probable significance of beaches as community recreational assets in addition to any tourism significance.
3.6.2 King Charles III England Coast Path and Margin.
Version and date created.
Version 2.2. Map was finalised as of June 2025.
What is this layer?
This layer (map 6.2) presents the location and route of the England Coast Path and Coastal Margin where it had been designated and defined up to 28 May 2025.
What data was used?
Natural England Coast Path and Margin data.
What are the attributes?
Coast Path attributes are the name of the Coast Path section and the "status" of the route. Status relates to the type of route over which the trail passes.
What are the limitations and caveats to content?
The England Coast Path and Margin are in the process of full designation and new sections will be added to the map over time. Sections shown are those that had been designated up to 28 May 2025.
There may be discrepancies between Coastal Margin in this map and that for Map 1.1 as Map 1.1 dates from March 2025.
3.6.3 Foreshore.
Version and date of layer.
Version 1.2. Map finalised January 2023.
What is this layer?
This layer (map 6.3) depicts the extents of "foreshore" around the English coast. Some foreshores may have permissive access if Crown Estate. Foreshore is defined by the Ordnance Survey as land that is between the high and low tide watermarks.
What data was used?
Ordnance Survey Open Map Local foreshore data.
What are the attributes.
There are no attributes.
Section 3.7 Module 7. Outdoor Recreation Valuation Model Version 3 - Spatial data
This module is in development. No content is currently included in the mapping but it is intended that the spatial (map) data used by the ORVal 3 model will be presented here in due course.
Section 3.8 Module 8. Access to Nature Official Statistic in development
This module uses the "Access to Greenspace" data published by Defra as corrected data in May 2025.
3.8.1 - Access to Nature Scenario 3 (Doorstep).
Version and date created.
Version 2.2. This layer was finalised in June 2025.
What is this layer?
This map (Map 8.1) presents statistical data from Defra Access to Nature Statistics for "greenspaces" first issued August 2024 and corrected May 2025 (data used). Data is presented at MSOA, LSOA and Output Area levels.
What data was used.
Defra Access to Nature (Greenspaces) Scenario 3 (Doorstep) as corrected and published May 2025.
ONS MSOA, LSOA and Output Areas Census 2021.
What are the attributes?
Location ID.
% Households within 15 minutes walk of an access point to Doorstep AGSt eligible greenspace.
What are the limitations and caveats to content?
Greenspaces may be missing from the OS and other source data.
Access Points to greenspaces may be incomplete.
3.8.2 Access to Nature Scenario 4 (Local).
Version and date created.
Version 2.2. This layer was finalised in June 2025.
What is this layer?
This map (Map 8.2) presents statistical data from Defra Access to Nature Statistics for "greenspaces" first issued August 2024 and corrected May 2025 (data used). Data is presented at MSOA, LSOA and Output Area levels.
What data was used.
Defra Access to Nature (Greenspaces) Scenario 4 (Local) as corrected and published May 2025.
ONS MSOA, LSOA and Output Areas Census 2021.
What are the attributes?
Location ID.
% Households within 15 minutes walk of an access point to Local AGSt eligible greenspace.
What are the limitations and caveats to content?
Greenspaces may be missing from the OS and other source data.
Access Points to greenspaces may be incomplete.
3.8.3 Access to Nature Scenario 5 (Neighbourhood).
Version and date created.
Version 2.2. This layer was finalised in June 2025.
What is this layer?
This map (Map 8.3) presents statistical data from Defra Access to Nature Statistics for "greenspaces" first issued August 2024 and corrected May 2025 (data used). Data is presented at MSOA, LSOA and Output Area levels.
What data was used.
Defra Access to Nature (Greenspaces) Scenario 5 (Neighbourhood) as corrected and published May 2025.
ONS MSOA, LSOA and Output Areas Census 2021.
What are the attributes?
Location ID.
% Households within 15 minutes walk of an access point to Neighbourhood AGSt eligible greenspace.
What are the limitations and caveats to content?
Greenspaces may be missing from the OS and other source data.
Access Points to greenspaces may be incomplete.
3.8.4 Access to Nature Scenario 7 (Partial Combined).
Version and date created.
Version 2.2. This layer was finalised in June 2025.
What is this layer?
This map (Map 8.4) presents statistical data from Defra Access to Nature Statistics for "greenspaces" first issued August 2024 and corrected May 2025 (data used). Data is presented at MSOA, LSOA and Output Area levels.
The data for the Partial Combined Scenario can be used alongside the "combined buffers" for the Doorstep, Local and Neighbourhood AGSt Standards.
What data was used.
Defra Access to Nature (Greenspaces) Scenario 7 (Partial Combined) as corrected and published May 2025.
ONS MSOA, LSOA and Output Areas Census 2021.
What are the attributes?
Location ID.
% Households within 15 minutes walk of an access point to any Doorstep, Local or Neighbourhood AGSt eligible greenspace.
What are the limitations and caveats to content?
Greenspaces may be missing from the OS and other source data.
Access Points to greenspaces may be incomplete.
Section 3.9 Module 9. Access to Nature Close to Home
3.9.1 - Access to Nature Close to home.
Version and date created.
V 2.1. Map finalised March 2024.
What is this layer?
The Nature Close to Home assessment aims to understand the supply of publicly accessible greenspaces that are likely to be reasonably nature rich and thus capable of providing a "contact with nature" experience on a regular, daily and local basis.
The assessment focusses on the supply of green spaces with a Naturalness rank of either 1 or 2. However, this is a general approach to assessing naturalness which means some of the level 2 spaces may not be that biodiverse at current time, although many may have potential for biodiversity enhancement.
To assess the supply of nature rich spaces close to home, a new "Close to Home" buffer of 300m was created around all greenspaces above 0.5 ha and ranked 1 or 2 for Naturalness.
The spaces included are thus those that are likely to be currently offering the most local opportunity to have contact with nature on a regular or routine daily basis.
For this assessment, two target groups were identified:
- Children and young people under 16.
- Older people 65+.
What data was used?
Data is presented at Local Authority level only.
Greenspaces data extracted from Map 1.1 (All Green and Blue Infrastructure Assets).
ONS Census 2021 age cohorts.
What are the attributes?
- Area unique name identifier.
- Total percentage population within the Nature Close to Home Buffer.
- Total population of children 15 and under within area.
- Estimated number of children cohort within the Nature Close to Home buffer.
- Total population aged 65 and over in area.
- Estimated number of older people cohort within Nature Close to Home buffer.
What are the limitations and caveats to content?
In order to derive population figures for the "Nature Close to Home Buffer" it has been assumed that population is evenly distributed across output areas. This will introduces some skewing of the data, likely to be most acute at LSOA level (particularly rural LSOA). For this reason the data is presented only at Local Authority and MSOA level.
Modules 10 and 11 - Accessible Greenspace Inequalities assessments.
Note on Modules 10 and 11. Accessible Green Space Inequalities layers.
See method statement for a full explanation of how these maps were generated.
This module is an assessment derived from the England AGSt assessment that looks at relative inequalities of provision of access to natural green spaces.
Maps of Accessible Greenspace Inequalities were generated at LSOA level only.
These maps explore the spatial relationship between supply of greenspaces (measured as % LSOA covered by the respective greenspaces and their AGSt buffer) across the range of AGSt Benchmarks and compares with one other variable.
The two variables selected for assessment were:
- Deprivation - as measured by the Index of Multiple Deprivation (MHCLG 2019 - please see note on interim amendment for this version using LSOA for the Census 21 data).
- Population Density - Derived from ONS Census 2021.
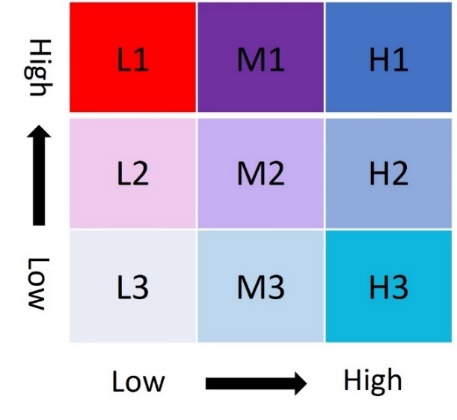
A bi-variate assessment grid was created with each sector of the grid shown below being assigned an alphanumeric code to represent it, creating a system of "Access Inequalities Categories".
Category L1 - represents the least favourable category.
Category H3 - represents the most favourable category.
Every LSOAs was assigned an alphanumeric code.
Figure 1. Accessible Greenspace Inequalities assessment method and criteria for assessment.
Bivariate Access Inequalities Classification.
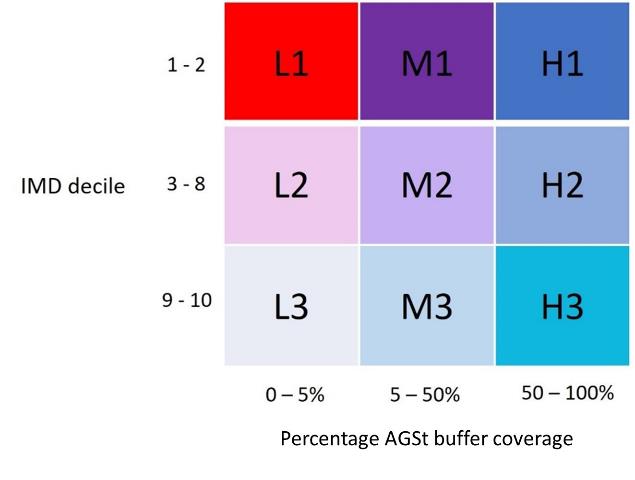
Application for Index of Multiple Deprivation.
Application for Population Density.
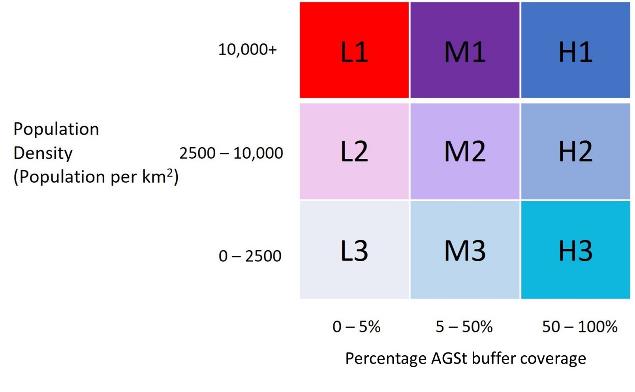
In this system L, M and H refer to low, medium and high for the percentage of the LSOA that is covered by the greenspaces and their respective buffers. The thresholds used are:
- L = Less than 5% coverage.
- M = 5% to under 50%.
- H = 50 % and over.
Codes 1, 2 and 3 are the relative bands for the other assessment variable.
For IMD the thresholds are:
- 1 = IMD decile 1 and 2 (Most deprived).
- 2 = IMD deciles 3 to 8.
- 3 = IMD deciles 9 and 10 (least deprived).
For population density the thresholds are:
- 1 = Population 10,000 people per square kilometre and above.
- 2 - Population between 2500 and 10,000 people per square kilometre.
- 3 = Population under 2500 people per square kilometre.
Assessments for modules 10 and 11 only look at green spaces included in the AGSt assessment. LSOA may contain other greenspaces whose presence will not be picked up in this assessment.
Section 3.10 Module 10. Accessible Greenspace Inequalities and Index of Multiple Deprivation (IMD)
3.10.1 - Accessible Greenspace and Deprivation.
Version and date layer created.
Version 2.1. This map was finalised in March 2024.
What is this layer?
This layer (map 10.1) presents LSOA with respect to level of supply of greenspaces compared with the IMD decile. Each LSOA is assigned an "access inequalities class" according to which of the boxes the statistics for AGSt Buffer coverage and IMD place it.
Maps are presented for all 6 AGSt buffer sizes.
Note on Index of Multiple Deprivation.
The Index of Multiple Deprivation (IMD) is the official measure of relative deprivation for small areas in England.
The IMD ranks every Lower Super Output Area (LSOA) in England from 1 (most deprived area) to 32,844 (least deprived area). Which are then organised into deciles (1 - most deprived and 10 = least deprived).
Information on the IMD can be found at
https://www.gov.uk/government/statistics/english-indices-of-deprivation-2019
Census 21 has resulted in the ONS issuing data using a new system of LSOA increasing their number to 33755 (an increase in 911). However, the LSOA IMD scores in V 2.2 are those issued in 2019 and are still to be updated to the new system.
In order to keep the Access Inequalities and IMD map functional with the V 2.1 update, IMD deciles for the new 911 LSOA have been generated with interim values pending the update to the IMD overall (Likely 2025).
This has resulted in the need to use lookup tables to join the 2011 LSOAs and the 2019 IMD decile values to 2021 LSOA boundaries. This has also required some judgement to be used translating old IMD deciles into new LSOA boundaries. The V 2.1 version of this map must thus be regarded as a "best guess" interim product until new IMD scores are issued.
The boundary changes between 2011 and 2021 meant some merging/splitting of LSOAs:
Where a new 2021 LSOA was created by merging 2 or more 2011 LSOAs, the lowest decile (most deprived) from the 2011 LSOAs to the new 2021 LSOA was assigned.
Where a 2011 LSOA was split to create two or more new 2021 LSOAs, both the new LSOAs were given the 2011 IMD decile value.
Where 2011 LSOA have been redesigned because of local authority district boundary changes, or to improve their social homogeneity, 2021 LSOA may not be easily mapped to equivalent 2011 LSOA like the regular splits. In such cases the ONS provide a best fit in their lookup tables so an IMD decile was assigned with respect to that "best fit".
This map will be refined once the updated IMD data is published.
What data was used?
The AGSt greenspaces and buffer was derived from the England AGSt Assessment (maps 2.1 to 2.6).
Index of Multiple Deprivation (IMD) 2019 (modified as above).
What are the attributes?
The maps provide five attributes:
- LSOA name.
- Access Inequalities class.
- Population as at Census 2021.
- IMD decile.
- Percent of LSOA area estimated to be within the AGSt buffer.
What are the limitations and caveats to content?
Greenspaces used for this assessment were those used for the England AGSt assessments. Accessible spaces that were not in the source data will not appear in the assessment which may affect the inequalities class attribution if actual amounts of greenspace are under-represented.
Note that the assessment for the "Doorstep" AGSt level includes "Playing Fields" and is thus based on a broader set of greenspaces than the other levels (which use those spaces assigned a naturalness factor of 1 and 2 only).
IMD deciles for LSOA that are newly derived from Census 21 have a "best guess" IMD decile attribution.
Section 3.11 Module 11. Accessible Greenspace Inequalities and Population Density
3.11.1 - Accessible Greenspace and Population Density.
Version and date of layer.
V 2.1. Map finalised March 2024.
What is this layer?
This layer (map 11.1) presents LSOA with respect to level of accessibility to AGSt greenspaces compared with population density. Each LSOA is assigned an "access inequalities class" according to which of the boxes the statistics for AGSt Buffer coverage and population density place it.
What data was used?
AGSt greenspaces and buffer coverage was derived from the England AGSt Assessment.
Population density was derived from the ONS Census 2021.
What are the attributes?
There are five attributes provided by the map:
- LSOA name.
- Access Inequalities Class.
- Population as at Census 2021.
- Population density (Census 2021).
- Percent of LSOA covered by the AGSt greenspace and its respective buffer.
What are the limitations and caveats to content?
All population data used in V 2.1 is Census 21 data (updating from Census 2011 of V 1).
Greenspaces used for this assessment were those used for the England AGSt assessments. Accessible spaces that were not in the source data will not appear in the assessment which may affect the inequalities class attribution if actual amounts of green space are under-represented.
Note that the assessment for the "Doorstep" AGSt level includes "Playing Fields" and is thus based on a broader set of green spaces than the other levels (which use those spaces assigned a naturalness factor of 1 and 2 only).
Section 3.12 Module 12. Combined Green Space and Linear Access Inequalities
3.12.1 Green space and linear access inequalities.
Version and date of layer.
Version 1.2. This layer was finalised in January 2023.
What is this layer?
This layer (map 12.1) is a 5 square km grid of England presenting the area of Accessible Greenspace in each square compared to the total length of PRoW in that square. Each square is assigned an "inequalities class" according to which of the boxes the statistics for Accessible Greenspace area and total PRoW length place it.
The class thresholds used are as follows (GS = greenspace. PRoW = Public Rights of Way):
- L1. Scenario low-low= "low GS - low PRoW". Thresholds = less than 12 ha greenspace and less than 22925m PRoW.
- L2. Scenario middle-low = "Middle GS - Low PRoW". Thresholds = between 12 and 98 ha of greenspace and less than 22925m PRoW.
- L3. Scenario high-low= "High GS - Low PRoW". Thresholds = Over 98 ha greenspace and less than 22925m PRoW.
- M1. Scenario low-middle = "Low GS - Middle PRoW. Thresholds = Less than 12 ha greenspace and between 22925m and 41031m of PRoW.
- M2. Scenario middle-middle = "Middle greenspace and middle PRoW" Thresholds = Between 12 and 98 ha of greenspace and between 22925 and 41031m PRoW.
- M3. Scenario high middle = "High greenspace and middle PRoW". Thresholds = Over 98 ha greenspace and between 22925 and 41031m PRoW.
- H1. Scenario low-high = "Low greenspace and high PRoW". Thresholds = Less than 12 ha greenspace and over 41031m PRoW.
- H2. Scenario middle high = "Middle greenspace and high PRoW". Thresholds = Between 12 and 98ha of greenspace and over 41031m PRoW.
- H3. Scenario high-high = "High greenspace and high PRoW". Thresholds = Over 98ha greenspace and over 41031m PRoW.
The threshold numbers were generated by the software used to undertake this assessment (Natural Breaks) and for convenient quoting can be rounded up or down. The classes are designed to resemble those used in the other access inequalities assessments.
What data was used?
GI database Accessible Green Infrastructure
GI database England PRoW
What are the attributes?
Inequality Class = The class into which that grid square falls
PRoW length = The length, in metres, of PRoW in that grid square
Greenspace Area = The total area, in hectares, of Accessible Greenspace in that grid square
What are the limitations and caveats to content?
Data for all Public Rights of Way (PRoW) could not be sourced for all local authorities. PRoW data used is as for V 1.2 and this module has not been updated for V 2.2 so that changes in the data since V 1.2 will not be represented. In addition, data sourced from Highway Authorities since the issue of V 1.2 will not be represented.
This is a measure of accessible green spaces supply using the typologies identified as accessible in table 1. Accessible greenspaces that are missing from the data will generate an underestimate. Polygons that have been identified as accessible but that in reality are not will result in an over-estimate of amounts.
Because this assessment uses a 5 sq km grid, some grid squares will cover parts of the edges of districts for which there is no actual PRoW data in the mapping. These squares may have distorted classifications.
Section 3.13 Module 13. Urban Habitat Maps (Broad Classes) - (Pilot and Phases 1, 2 and 3 trials)
Note on Urban Habitat Mapping.
These maps represent an experimental module presenting some preliminary outputs from a new Earth Observation based approach to generating maps of "Urban Habitats". Work is currently underway to review the Urban Habitat Maps which will result in some changes to the maps presented here which should be viewed as initial products only.
The method to create Urban Habitat Maps is complex and full details of the approach are set out in the Method Statement.
Urban Habitat Maps are being developed for the main urban conurbations of England. But not all urban centres have been mapped.
The maps seek to provide data on the physical composition of the Urban Ecosystem and uses a bespoke schema of "Broad" and "Detailed" Detailed Urban Habitats.
3.13.1 Urban Habitat Maps (Broad Classes).
Version and date of layer.
Version 2.1. This layer was finalised in April 2025.
However, the data is brigaded from the 3 pilots and 3 trial phases of activity that were done as follows:
- Pilots (Cambridge, Plymouth and City of Manchester) completed summer 2022.
- Phase 1 (Tyneside, Greater Manchester - except city of Manchester, and West Midlands) completed March 2023.
- Phase 2 (Liverpool City Region with Warrington, West Yorkshire, Greater London) completed March 2024.
- Phase 3 (Teesside, Sheffield and Rotherham, Stoke on Trent and Newcastle under Lyne, Coventry, Derby, Nottingham, Leicester, Dartford and Gravesham) completed November 2024.
What is this layer?
This module presents the results of the Urban Habitat Mapping pilots and trials. The maps are generalised raster based (image) depictions of the actual Broad Urban Habitat Map data. Generalisation has been done to create an Open Government Licensable product because the actual maps are not open.
Urban Habitat maps are presented for Broad Classes only. Detailed Class maps are highly complex and proved unsuitable for presentation on the GI Mapping site.
The maps present the data as 5x5 square metre pixels.
The maps are brigaded into regions based for ease of presentation.
What data was used?
The Urban Habitat Maps are complex data products that include some non-open data. For this reason, the actual data cannot be published under Open Government License and Natural England have been granted special permission by the OS to publish maps as image files only. The actual data files are available to share on application to Natural England to organisations that hold PSGA or equivalent OS license.
The data sources used are:
- Green Infrastructure and Blue Infrastructure assets (Open Government Licence).
- Aerial Photography for Great Britain (Public Sector Geospatial Agreement - PSGA).
- Ordnance Survey British National Grid (Open Government Licence).
- Ordnance Survey Master Map (PSGA).
- National Forest Inventory (Open Government Licence).
- Environment Agency National LiDAR Programme (Open Government Licence).
- OS Open Built-Up Areas (Open Government Licence).
- Selected Priority Habitat Inventory (Open Government Licence).
- Moorland Line (Open Government License).
What are the attributes?
Because the Urban Habitat Maps on the GI Mapping site are image files only, there are no attributes and a colour coded key is included to differentiate habitat areas.
What are the limitations and caveats to content?
The Urban Habitat maps are an Earth Observation data-based product that delivers a probability map based on the ability to detect and differentiate features in the data based on a schema.
Limits of depiction. The minimum depicted unit on the map is 5x5 square metres and features smaller than this will not have been displayed individually.
Limits of differentiation. Some habitat types are more difficult to differentiate than others so that accuracy of habitat classification varies by habitat type and whether it is broad or detailed class (the former having higher levels of accuracy). In addition, confusion in classification can increase as the size of the feature approaches the minimum mappable unit.
Date of source data. The approach has used data most easily available to Natural England to undertake the mapping. Datasets may have different year and month dates (this is especially relevant to the Aerial and LiDAR data tiles). This can introduce errors in detection probability and attribution of habitat type.
Section 3.14 Module 14. Urban Habitat Summary Grids
3.14.1 - Urban Habitat Summary Grid.
Version and date of layer.
Version 2.2. This map was finalised in April 2025 (but see 3.13.1 for dates of data creation).
What is this layer?
This map uses the 250m Greenness Grid as a framework to present a summary of the amounts of selected Broad and Detailed Urban Habitat Classes within the grid square in hectares.
The summary is simplified so that not all classes are represented.
A "% manmade surface" derived from the Greenness Grid is provided for comparison.
The summary is intended to provide some information on the types of Urban Habitat within the non-manmade surface area of the grid square. Only the more common Urban Habitats are listed for simplicity.
What data was used?
The map presents summaries of some of the data for Broad and Detailed Urban Habitat Classes from the Urban Habitat Maps.
What are the attributes?
Each grid square has attributes listing:
- % man-made surface (from the Greenness Grid data).
- List of selected Broad and Detailed Habitat Class with areas present within the grid square in hectares.
What are the limitations and caveats to content?
It is not possible to add up the "% man-made surface" with the Urban Habitat amounts as they are derived from different data and methods of assessment.
The "% man-made surface" is derived from OS data that does not included man-made surfaces in gardens. However, the Urban Habitat Data does identify "Non-vegetated gardens" and the totals will reflect that.
The presented habitat totals are not likely to add up to 100% of the grid Square because those presented are a selected and limited list.
Section 3.15 Module 15. Urban Habitat Naturalness Maps
Maps in this module are experimental and designed to seek feedback for further development.
3.15.1 - Urban Habitat Naturalness Maps.
These maps are in development. No content is currently included in the mapping. When finished these maps will show a form of "heat map" of the "Naturalness" factor across an entire area.
3.15.2 - Combined Naturalness Factor Maps.
Version and Date.
Version 2.2. This map was finalised in June 2025.
What is this layer?
This map (Map 15.2) displays the outputs from a developmental method for understanding the aesthetic quality of "naturalness" in areas of Accessible Greenspaces.
Naturalness in this assessment is concerned with the degree to which people using the greenspace might consider the level of management the space is subject to. This ranges from lowest intervention and highest "naturalness" (Factor 1) to Highest intervention and lowest "Naturalness (factor 6).
The factors are calculated based on the range and proportion of the mix of Detailed Urban Habitats contained within the polygon. The full method is set out in the V 2.2 Method Statement.
However, in essence the maps are generated by first using the Accessible Green Infrastructure polygons, disaggregating these into units using the Combined Green and Blue Infrastructure data and then calculating the Combined Naturalness factor using the Detailed Urban Habitat data.
What data was used?
This map uses:
- Combined Green and Blue Infrastructure data from map 1.1
- The Accessible Green Infrastructure data from map 1.2.
- The Detailed Urban Habitat Mapping Data (This is not displayed on site due to data size and complexity issues).
What are the attributes?
There are 2 attributes:
- N Factor - the combined naturalness factor of the polygon.
- The Urban Habitat Mapping from which the Combined Naturalness factor was derived.
What are the limitations and caveats to content?
Accessible Green Infrastructure that is missing from map 3.1 will not be represented in the map.
For the pilot and phase 1 maps, areas of Access Land were included in the assessment. These typologies were subsequently removed from later mapping but remain in the earlier phases. This can distort the earlier maps. This issue is currently being addressed.
The internal polygon compartments used are as at the time the data to create the Combined Green and Blue Infrastructure data for map 1 and may have changed since the data was imported.
Some polygons have two Combined Naturalness factors. This is because with the initial Urban Habitat Map versions there can in some places be overlaps where mapping occurred in 2 different versions. This means data was generated at different times using different methods and the underpinning Urban Habitat data may thus have changed. In these cases, the Urban Habitat Map version is identified for each Combined Naturalness Factor. Data overlaps are being removed and will not appear in future iterations.
The identification of Detailed Urban Habitat types is subject to error and confusion as detailed in the Method Statement.
Section 3.16 Module 16. Urban Heat Management
Maps in this module are the results of some experimental work to develop an initial assessment of (a) the likelihood of cooling from existing urban green infrastructure (provision) (b) community need for cooling taking account of climate gradients and social characteristics (need) and (c) the degree of geographical alignment between cooling provision and social need (this latter category of mapping is not presented as a map on the site but is included in the data attached to the LSOA attributes.
The detailed assessment method is set out in the Method Statement.
The "provision" and "need" maps are presented as toggle options under the name "Urban Heat Management LSOA".
3.16.1 - Provision of urban cooling by Green Infrastructure.
Version and date.
Version 2.1. This layer was finalised in March 2024 but data used may be earlier.
What is this layer?
This layer (map 16.1) depicts the likely level of urban cooling function (ecosystem service) provided by the green infrastructure within an LSOA. The map was generated by using an average of the Heat Mitigation Index (HMi) for the 250m grid squares within the LSOA. The resulting map uses the derived average HMi value and is standardized against the England Mean value using "Z scores". "Z" or zero equals the English Mean HMi average for LSOA and score values chart the degree to which an individual LSOA is either above (positive score) or below (negative score) the English Mean value presented as Standard Deviations.
What data was used?
See section Heat Management section of the Method Statement.
What are the attributes?
Attributes for both the provision and needs maps are combined.
Note on Z-scores. Z-scores measure the departure from the stated mean HMi value LSOA across England. Positive scores give the standard deviation above mean and negative scores below.
Note on Standard Deviation. Standard Deviation is a mathematical measure of the amount of variability in a dataset with reference to its mean value. A small range in standard deviation indicates that data are more tightly clustered around the mean with a large range indicating a bigger spread of difference from the mean. One Standard Deviation is the square root of the variance.
LSOA name.
Need - Standardised score for need for cooling ((0 = English Mean, negative scores denote lower need for cooling, positive scores denote higher need for cooling).
Provision - Standardised score for Provision of Cooling from Green Infrastructure (0 = English Mean, negative scores denote below average cooling, positive scores denote above average cooling).
Mean - Average cooling value for Green Infrastructure per LSOA (0 = 1 to 1 = High GI Cooling). Derived from a average of the HMi values for the grid squares within the LSOA.
What are the limitations and caveats to content?
There are a complex range of issues with how the source data have been used to generate the maps and these are set out in the Method Statement.
Issues relate to;
Estimates of land cover characteristics.
Generalised data availability on built cover intensities in the LCM2020 data affecting understanding of vegetation cover.
The cooling distance (dcool) parameter is interpreted very differently in the sources consulted making it uncertain. These values are expected to differ according to the size of areas, the time of year and time of day.
Published values of UHI intensity are variable according to the time frames of assessment and source of input data. This remains an uncertainty in the model outputs, though it should be noted that the outputs used in the HMi do not directly use these data as they are required to run the model and for air temperature estimates only.
The InVEST model is empirically based and does not take account of feedbacks which may render the cooling from vegetation lower in reality, for instance as a result of water availability. The values pertain to summer periods but will not always represent relative cooling values during actual extreme events.
The InVEST model is primarily focussed on vegetation cooling and is less well suited for estimating the effect of cooling from water bodies.
There has been only a basic validation of model outputs.
3.16.2 Need for cooling - Heat disadvantage.
Version and date of layer.
Version 2.1. This map was finalised in March 2024.
What is this layer?
This map displays a measure of "Heat Disadvantage" experienced by communities.
Heat disadvantage was estimated by combining social vulnerability data with a measure of heat hazard-exposure.
The social vulnerability data were developed using a previously published methodology (Social Vulnerability to Heat (see www.climatejust.org.uk) with updated data and minor modifications to underpinning domains to reflect emerging data and evidence in the literature.
Heat hazard-exposure was developed using UKCP18 model outputs for the top 5% hottest summer day (standardised using z-scores) under a 3 degree C warming scenario relative to means in the recent past (the 30 year mean 1990-2019).
What data was used?
Social Vulnerability to Heat data (www.climatejust.org.uk)
Heat Hazard Exposure UKCP18 model.
What are the attributes?
Attributes for both the Provision and Needs maps are combined - see notes above.
What are the limitations and caveats to content?
For caveats and limitations, please refer to www.climatejust.org.uk.
3.16.3 Heat Mitigation Index Grid (HMi).
Version and date of layer.
Version 2.1. Layer finalised in March 2024.
What is this layer?
The map presents estimates of the cooling effect of urban green infrastructure using a 250m grid (please note that this uses the Greenness Grid from V 1.2 which has been changed to bring into alignment with the OS National Grid for V 2.1. The two grids are slightly out of alignment).
The estimates have been made using the InVEST tool (Natural Capital Project, 2023). InVEST's urban cooling model estimates the degree of cooling provided by green infrastructure. In this work, model runs were set up to represent average characteristics expected in towns and cities within an English context.
The model calculates a Cooling Capacity index for each data unit based on assumptions about the shading, evapotranspiration and albedo characteristics of different land covers. A further consideration is made of the size of vegetated areas (i.e. > 2 hectares) and their influence on surrounding areas to calculate a Heat Mitigation index (HMi). This helps to take account of the 'cool islands' associated with discrete green space parcels such as public parks and gardens.
What data was used?
The InVEST cooling model was used with the following data inputs:
- The Centre for Ecology and Hydrology (CEH) 10m UK Land Cover Map (LCM) 2020.
- The biophysical input dataset was adapted for England and derived from evidence in UK and European literature.
- Evapotranspiration. Daily total potential evapotranspiration has been used for July at 12 km resolution derived from the UK Climate Projections 2018 Regional Climate Model ensemble 1980-2080.
Areas of interest were used as the basis for aggregating and summarizing the final results. 14 individual zones were used based on UK Met Office climate districts. The zones account for climate zones across England for which average rural background values and UHI intensities can be assessed. The original Met Office zones were further differentiated to account for topographical barriers, built up area extents (i.e. to minimise urban areas being split over different zones) and differences observed in 1km Met Office datasets. Each zone was modelled separately with a 5km buffer except the zone containing London which used a 25km buffer. The results were clipped to the original zone extent after processing. This was necessary to account for the influence of surrounding land covers on urban zones towards the edges of each area of interest.
What are the attributes?
Heat Mitigation Index (0 = low, 1 = high).
Man made area = amount of area that is "manmade".
Urban - 1 = yes, 0 = no.
Section 3.17 Module 17. Urban Air Quality and Green Infrastructure
Provision of and need for fine particulate matter (PM2.5) removal: Greater Manchester Test Case.
The detailed method of creation for these maps is set out in the Method Statement.
This module presents a test case application of a method to assess the role Green Infrastructure might be providing in terms of the removal of small air pollution particles (PM 2.5) for urban air and assesses local "need" for the ecosystem service of local air quality management.
3.17.1 Provision of PM 2.5 removal service by Green Infrastructure.
Version and date of layer.
Version 2.1. Map finalised March 2024.
What is this layer?
This map attempts to assess the likely performance of local Green Infrastructure in removing small particulate matter (PM 2.5) from the air and thus potential for making a contribution to the management of local air quality with respect to small particulate matter concentrations.
The map shows the estimates for PM2.5 removal data as LSOA level averages (which were calculated from an underpinning assessment using a 250 sqm grid). The averages were standardised using z-scores to represent values relative to the test case (Greater Manchester) mean.
What data was used?
- Defra (2024) UK Air Information Resource: Modelled background pollution data.
- ONS Natural Capital Accounts 2023.
- Natural England Urban Habitat Maps (Greater Manchester and City of Manchester Version 2.1).
- CEH 1km pollutant removal grid 2017 (used for validation only).
What are the attributes?
Note on Z-scores. Z-scores measure the departure from the stated mean value for individual grid squares. Positive scores give the standard deviation above mean and negative scores below.
Note on Standard Deviation. Standard Deviation is a mathematical measure of the amount of variability in a dataset with reference to its mean value. A small range in standard deviation indicates that data are more tightly clustered around the mean with a large range indicating a bigger spread of difference from the mean. One Standard Deviation is the square root of the variance.
LSOA name.
Need for PM 2.5 removal - Standardized score for "Need for PM2.5 removal. Created from a Z-score of combined (mean) physical and social need Zscore (restandardised). 0 = Greater Manchester Mean, negative scores denote lower need for PM2.5 removal, positive scores denote higher need for PM2.5 removal).
Annual PM2.5 removal rate - Aereal rate of PM2.5 removal taking account of differing LSOA areas.
Annual PM2.5 pollution estimate - Annual mean PM2.5 data (ug m-3) apportioned as an average for each LSOA. Estimates level of PM2.5 pollution.
Provision of PM 2.5 removal - Z-score of PM25kgkm2 Standardised score for Provision of PM2.5 removal from Green Infrastructure (0 = Greater Manchester Mean, negative scores denote below average PM2.5 removal, positive scores denote above average PM2.5 removal).
Annual estimate of PM2.5 removed by GI - Total kg PM2.5 removed generated as a total of all 5m cells within each LSOA boundary (g converted to kg).
What are the limitations and caveats to content.
Detailed understanding of the limitations of this mapping is to be found in the relevant section of the Method Statement.
This assessment has used spatially-averaged estimates of PM2.5 pollution removal values which do not capture the full variation within Local Authorities. The use of spatially-averaged PM2.5 pollution removal values leads to under- and over-estimates at the local level as an inevitable consequence of the methodology. It should be noted that considerable variability within habitat classes should be expected, for instance due to species, configuration and structure, and positioning relative to emissions sources.
Natural England Urban Broad Habitat classes are not fully aligned with Natural Capital Accounts habitat classes. Differences in the classifications require assumptions to be made to attribute Natural Capital Account habitat-based PM2.5 pollution removal totals to Natural England Urban Broad Habitat classes. There is some uncertainty inherent in this process.
The latest Natural Capital Accounts shows that 'Enclosed Farmland' in Trafford and Salford had a marginal positive net contribution to PM2.5 concentrations. In other words they have been estimated to increase rather than offset PM2.5 concentrations (values of -1 kg and -21kg for Trafford and Salford respectively for 2022). ONS reconfirmed 'Enclosed Farmland' as a pollution source, though for the purposes of this assessment they have been attributed a 0 PM2.5 pollution removal value. This is expected to have little impact on the estimates for Salford, but with a larger impact on estimates for Trafford.
3.17.2 Need for urban PM 2.5 pollution removal.
Version and date of layer.
Version 2.1. This map was finalised in March 2024.
What is this layer?
This map attempts to display locations of higher or lower "need" for the removal of small particulate matter (PM 2.5) to help improve local air quality.
The need for PM2.5 pollution removal has been divided into two components:
- Physical need - concentrations of PM2.5 as an annual mean for 2022 expressed in µg m-3 (Defra 2024). The 1km resolution data were re-apportioned to average concentrations across LSOAs. This parameter represents a measure of the need to physically remove particulate matter due to high concentrations in local air quality.
- Social need - Years of Life Lost as a measure of poor health. These data were available at LSOA level and standardized to the Greater Manchester average. This parameter uses Years of Life Lost as an indicator for where improved air quality might make a contribution to reduction of the indicator.
Maps were created showing "Physical Need" and "Social Need".
What data was used?
Concentrations of PM2.5 as an annual mean for 2022 expressed in µg m-3 (Defra 2024).
Years of Life Lost.
What are the attributes?
As for 3.17.1.
What are the limitation and caveats to content?
Further (or alternative) measures of social need could be considered. For the purposes of this assessment a single dataset has been used as an exemplar.
It is acknowledged that PM2.5 concentrations are included within the process used to estimate PM2.5 removal rates for vegetation. Although this brings an element of circularity in the current assessment, it is nevertheless considered important to represent the PM2.5 pollution gradient as part of the relative pattern of need. It should be noted that the placement of interventions within neighbourhoods should take account of positioning relative to emission sources, see for example the recommendations guide produced by the Greater London Authority (2019).
Section 3.18 Module 18. Urban Food Production - Greater Manchester Test Case
Maps showing provision, need and opportunity for local food growing are presented as toggles.
Please see the Method Statement for details of how the assessment was undertaken.
3.18.1 Local Urban Food Production.
Version and date of layer.
Version 2.1. Layer finalised in March 2024.
What is this layer?
This map shows the estimated distribution of the production of local urban food.
Local food growing associated with allotments, community gardens and private gardens has been estimated using assumptions from field surveys published in the academic literature for Leicester, Cardiff and Oxford.
Estimations are presented of area devoted to local food production for each LSOA, both as a total for each category and as an area-weighted measure. The latter was standardised using z-scores to represent values relative to the test case (Greater Manchester) mean (0 = GM Mean, -ve scores below GM Mean, +ve scores above GM Mean) and used as the measure of Provision.
What data was used?
The following datasets have been developed:
- Lower Super Output Area (LSOA) provision of, and need for, local food growing:
- Provision of local food growing (estimated vegetable and fruit area in allotments and gardens)
- Need for local food growing (according to the CDRC Priority Places for Food Index)
- Opportunity for engaging in food production as a combination of (a) the proximity to allotments and community gardens and (b) the area of vegetated private gardens
- Areas combining Provision, Need and Opportunity
- A 250m gridded representation of estimated vegetable and fruit area likely to be associated with allotments and gardens
What are the attributes?
Note on Z-scores. Z-scores measure the departure from the stated mean value for individual grid squares. Positive scores give the standard deviation above mean and negative scores below.
Note on Standard Deviation. Standard Deviation is a mathematical measure of the amount of variability in a dataset with reference to its mean value. A small range in standard deviation indicates that data are more tightly clustered around the mean with a large range indicating a bigger spread of difference from the mean. One Standard Deviation is the square root of the variance.
LSOA name.
Estimated area producing food - Sum of area estimated to be associated with vegetable and fruit production (m2), Sum of AtVFm2 and GdVFm2.
Area of allotments producing food - Total estimated m2 vegetation/fruit production from allotments and community gardens generated as a total of all 5m cells within each LSOA boundary (using a proportional estimate based on academic literature).
Area of vegetated gardens - Total area of vegetated garden calculated from the Natural England detailed habitat layer for Greater Manchester.
Estimated garden area producing food - Total estimated m2 vegetation/fruit production from private gardens generated as a total of all 5m cells within each LSOA boundary (using a proportional estimate based on academic literature).
Level of local food production (Provision) - Z-score of VFm2km2NE, Standardised score for Provision of local food production from allotments, community gardens and private gardens (0 = Greater Manchester Mean, negative scores denote below average, positive scores denote above average).
Need for local food production - Z-score of combined, standardised score for Need for local food production (0 = Greater Manchester Mean, negative scores denote lower need, positive scores denote higher need). Generated from the CDRC Priority Places for Food Index Data version 1.
Opportunity for local food growing. Assessed be generating data for the mean distance to an allotment or community garden within the built-up area extent of Greater Manchester and estimates of total area of vegetated private garden space.
CDRC Index - Priority Places for Food Index Data (Ranks of LSOAs across England).
What are the limitations and caveats to content?
This assessment has used spatially-averaged assumptions about the proportion of private gardens and allotments and community gardens associated with vegetable and fruit growing. Just as the proportion of cultivated area varies across different sites, so the proportion of vegetable and fruit growing in the cultivated areas will vary due to environmental and socio-cultural factors. As an example, the area of cultivated gardens in Manchester City is very varied. Recent estimates have shown a cultivated proportion of 11.8% and cases up to 77.14% (Baker, 2018). However, it is not known what proportion of this cultivated area is associated with vegetable and fruit growing.
Some growing of vegetables, fruits and herbs takes place in very small spaces which are difficult to record and represent, including in other land use types, such as schools and amenity grassland areas. This assessment has not considered these additional small scale local production sources.
3.18.2 Need for Local Urban Food Production.
Version and date layer created.
Version 2.1. This layer was finalised in March 2024.
What is this layer?
The need for local food production is taken directly from the Consumer Data Research Centre CDRC (2022) (which is led by Leeds University and University College London) Priority Places for Food Index standardised to represent the Need for local food production data layer. It is a combination of the following domains:
- Proximity to supermarket retail services (distance to large grocery stores and count of stores within 1km)
- Accessibility to supermarket retail facilities (average distance travelled and journey time via public transport)
- Access to online grocery deliveries and propensity to shop online
- Proximity to non-supermarket food provision (distance to markets, count of markets within 1km and count of non-supermarket retail food stores within 1km)
- Socio-economic barriers (lack of car access)
- Family food support (free school mean eligibility; Healthy start voucher usage; distance to the nearest foodbank)
- Fuel Poverty (Proportions of households in fuel poverty; prepayment meters)
What data was used?
CDRC (2022) Priority Places for Food Index.
What are the attributes?
See as for 3.15.1.
What are the limitations and caveats to content?
Further (or alternative) measures of social need could be considered. For the purposes of this assessment a single dataset has been used as an exemplar.
The CDRC (2022) Priority Places for Food Index is reported as ordinal data for England as a whole. It is acknowledged here that z-scores are technically inappropriate for use with ordinal data. However, given that Greater Manchester has been taken as a sample of ranks for England (ranging 4-32818 from a possible range 1-32844) these data have been taken as pseudo-continuous.
3.18.3 Opportunity for Local Urban Food Production.
Version and date layer created.
Version 2.1. This layer was finalised in March 2024.
What is this layer?
Opportunity has been mapped with reference to two parameters:
- Proximity to allotments by LSOA. Distance has been calculated as the mean distance to an allotment within the built-up area extent of Greater Manchester. This assessment was made using allotments identified in the England Green Infrastructure mapping dataset with the urban extent defined using the Natural Capital Accounts urban boundary.
- Availability of private gardens. Private gardens offer opportunity to grow food. This option will be much reduced where there are no private gardens, or where private gardens are relatively small. To account for this opportunity, a measure of the total area of vegetated private garden space has been used as a proxy for the opportunity for local food production in private gardens.
Both measures of opportunity were converted to z-scores and combined to produce the final Opportunity measure (representing lack of opportunity).
What data was used?
Combined Green and Blue Infrastructure Map 1.1.
Private Gardens area (Map 1.11).
ONS LSOA 2021.
What are the attributes?
See as for 3.18.1.
What are the limitations and caveats to content?
Proximity has been assessed using an as-the-crow-flies measure within the urban boundary. This is due to built-up areas having relatively dense networks of roads and paths. Some allotments and community gardens are located outside of the boundary and so are excluded. Network analysis-based assessment of proximity would give more reliable estimates of the accessibility of community growing spaces.
The use of vegetated garden areas as a proxy for local food growing opportunities does not take account of areas which may be unsuitable, for instance due to shading or other environmental factors. Equally, there may be opportunities for local food production in garden areas which are not classified as being vegetated.
Section 3.19 Module 19. Sports, Play and Active Recreation provision
3.19.1 Sports, Play and Active Recreation Provision.
Version and data of layer.
Version 1.2. This layer was finalised in Autumn 2022 and has not ben updated.
What is this layer?
This layer presents data relating to places that provide opportunity for sport, play or active forms of recreation. These facilities and places may or may not be publicly accessible and some will be indoor facilities only.
What data was used?
The data for this layer was extracted from the OS Open Greenspace data for the following typologies:
- Activity Spaces.
- Golf Courses.
- Other Sports Facilities.
- Play Space Provision.
- Playing Fields.
What are the attributes?
The only attribute identifies the typology of the polygon.
What are the limitations and caveats to content?
The data is extracted directly from the source data and any facilities or spaces not represented in that data will not be included.
3.19.2 Sports Facilities.
Version and date of layer.
Version 1.2. This layer was finalised in Autumn 2022.
What is this layer?
This layer is a point data set showing sports facilities open to the public that offer outdoor recreation.
What data was used?
Sport England Active Places Power - data relating to grass pitches, artificial grass pitches, golf courses and outdoor tennis courts was extracted.
What are the attributes?
Name = The name of the sport facility
Postcode = The postcode of the sports facility
Management = The organisation responsible for management of the sports facility
Facility type = The type of sport facility e.g. grass pitch
Access Group = Who can access the sports facility
Access Type = How access is granted to the sports facility
Local Authority = The local authority in which the sports facility is situated.
What are the limitations and caveats to content.
This data set does not represent all sports facilities across England and focuses only on outdoor recreation.
While some sports facilities are accessible to the public, access to others may be through membership of sports clubs or organisations only. Furthermore, there may be limitations to sport facility access through seasonality or time of day.
Sport England update the Active Places Power dataset regularly; such regular updates will not be reflected in the Green Infrastructure output as the Green Infrastructure mapping is not updated at the same time as change occurs to the Sport England data.
Section 3.20 Module 20. People and Nature Survey
The Adults' People and Nature Survey for England
The People and Nature Surveys for England (PaNS, https://www.gov.uk/government/collections/people-and-nature-survey-for-england) are social surveys, that gather data about people in England's access, engagement with and the benefits they derive from nature, as well as the value they place on it and the actions they take to protect it.
Statistics from PaNS are currently published as accredited official statistics. Data are collected via an online panel of adults aged 16 years and older, with the aim to collect about 25,000 data points per year. To achieve a nationally representative sample of people in England, quotas on age, gender, region, ethnicity and education are used to control the sample composition during data collection and weights must be applied when analysing the data. PaNS follows a modular approach, in which certain questions are asked to different groups of respondents, to maximise the number of questions that can be asked.
This module presents three questions from the Adults' People and Nature Survey for England. One question concerning the change in quality of local greenspaces, one about people who visited green and natural spaces in the past 14 days and one about mental health and wellbeing benefits of green and natural spaces close to home. The first four full years of PaNS data were analysed (April 2020 to March 2024) to ensure a sufficiently large sample size. Only responses from those who provided a postcode or their local authority and answered the relevant questions could be included in the analysis.
The module provides the PaNS data grouped to two spatial extents: Local Authority District 2023 (LA) and LNRS (Local Nature Recovery Strategy, https://www.gov.uk/government/publications/local-nature-recovery-strategies-areas-and-responsible-authorities) areas.
3.20.1 - Perceptions of greenspace quality.
Version and date of layer
Version 2.2 - This map (Map 20.1) was finalised in March 2025.
What is this layer?
This layer presents public perceptions of greenspace quality collected through the Adults' People and Nature Surveys for England (PaNS).
This layer presents question M1_Q3 from PaNS which asks, "Thinking of green and natural spaces close to where you live, have they improved or reduced in the last 5 years, or have they not changed?". The layer shows net perceptions of change to local greenspace quality by subtracting the percentage of respondents saying that the quality of local greenspace has 'reduced' from those saying that it has 'improved'.
What data was used?
For both, the LA and LNRS layer, PaNS secure access data were used.
What are the layer attributes?
There are five attributes provided by the map:
- Proportion Net Improved (Improved minus Reduced): value when subtracting the "Proportion Improved" by the "Proportion Reduced". This is the value shown in the map.
- Unweighted base size: unweighted sample size for particular LA / LNRS.
- Proportion Improved with 95% confidence interval: weighted percentage of respondents responding either "improved a lot in the last 5 years" or "improved a little in the last 5 years" and the 95% confidence interval for this value.
- Proportion Reduced with 95% confidence interval: weighted percentage of respondents responding either "reduced a lot in the last 5 years" or "reduced a little in the last 5 years" and the 95% confidence interval for this value.
- Proportion Other (Don't know, Prefer not to say) with 95% confidence interval: weighted percentage of respondents responding either "Don't know", or "Prefer not to say" and the 95% confidence interval for this value.
What are the limitations and caveats to content?
Data presented in this layer were gathered over a four-year period. Aggregating data across four years was required to provide a sufficiently large sample size, but this has resulted in data from 2020 being aggregated with data collected in 2024.
Despite the aggregation of data, sample sizes remain small, and confidence intervals for the statistics presented in the mapping are larger than would ideally be the case.
It is also likely that due to mapping only including responses from participants who provided a postcode / their local authority, that this data is skewed towards those population groups who are more likely to provide this information in social research. The data presented here may therefore overrepresent the views of certain groups living in an area and underrepresent the views of others.
To achieve nationally representative results, weights must be applied when analysing the data. The weights were derived to calculate statistics for England and might not be accurate for different spatial scales. As specific weights for LA and LNRS levels are not available, the national level weights were applied.
3.20.2 - Visits to greenspace in previous 14 days.
Version and date of layer.
This map was finalised in March 2025.
What is this layer?
This layer presents data about visits to greenspace in England, representing the percentage of population in each area reporting having made a visit to nature in the previous 14 days. This data has been collected through the Adults' People and Nature Surveys for England (PaNS).
This layer presents proportions calculated from the Any_Visits_14 column in the PaNS data, displaying the proportion of people who visited a green and natural space in the past 14 days. The column is derived from responses to "How many times, if at all, did you make this type of visit to green and natural spaces in the last 14 days?"
What data was used?
For both, the LA and LNRS layer, PaNS secure access data were used.
What are the layer attributes?
There are four attributes provided by the map:
- Unweighted base size: unweighted sample size for particular LA/LNRS.
- Proportion Yes with 95% confidence interval: weighted percentage of respondents responding "Yes" to have had a visit to green and natural spaces in the last 14 days and the 95% confidence interval for this value.
- Proportion No with 95% confidence interval: weighted percentage of respondents responding "No" to have had a visit to green and natural spaces in the last 14 days and the 95% confidence interval for this value.
- Proportion Other (Don't know, Prefer not to say) with 95% confidence interval: weighted percentage of respondents responding either "Don't know", or "Prefer not to say" and the 95% confidence interval for this value.
What are the limitations and caveats to content?
Data presented in this layer were gathered over a four-year period. Aggregating data across four years was required to provide a sufficiently large sample size, but this has resulted in data from 2020 being aggregated with data collected in 2024. The effect of this may be particularly pronounced as the data aggregates responses from periods during which COVID-19 restrictions were in effect with periods where there were no such restrictions.
Despite the aggregation of data, sample sizes remain small, and confidence intervals for the statistics presented in the mapping are larger than would ideally be the case.
It is also likely that due to mapping only including responses from participants who provided a postcode / local authority, that this data is skewed towards those population groups who are more likely to provide this information in social research. The data presented here may therefore overrepresent the views of certain groups living in an area and underrepresent the views of others.
To achieve nationally representative results, weights must be applied when analysing the data. The weights were derived to calculate statistics for England and might not be accurate for different spatial scales. As specific weights for LA and LNRS levels are not available, the national level weights were applied.
3.20.3 - Mental health and wellbeing benefits
Version and date of layer.
This map was finalised in March 2025.
What is this layer?
This layer presents public perceptions of mental health and wellbeing benefits of local greenspace collected through the Adults' People and Nature Surveys for England (PaNS).
This layer presents question M1_Q5_b from PaNS which asks "Now, thinking about green and natural spaces close to where you live, how much do you agree or disagree with the following statements? My local green and natural spaces actually are: Good places for mental health and wellbeing.". The layer shows the proportions of respondents that agreed with the statement, combining answer options strongly agree and agree.
What data was used?
For both, the LA and LNRS layer, PaNS secure access data were used.
What are the layer attributes?
There are four attributes provided by the map:
- Unweighted base size: unweighted sample size for particular LA / LNRS.
- Proportion Agree with 95% confidence interval: weighted percentage of respondents responding either "Strongly agree" or "Agree" and the 95% confidence interval for this value.
- Proportion Disagree with 95% confidence interval: weighted percentage of respondents responding either "Strongly disagree" or "Disagree" and the 95% confidence interval for this value.
- Proportion Other (Neither agree nor disagree, Don't know, Prefer not to say) with 95% confidence interval: weighted percentage of respondents responding either "Neither agree nor disagree", "Don't know" or "Prefer not to say" and the 95% confidence interval for this value.
What are the limitations and caveats to content?
Data presented in this layer were gathered over a four-year period. Aggregating data across four years was required to provide a sufficiently large sample size, but this has resulted in data from 2020 being aggregated with data collected in 2024.
Despite the aggregation of data, sample sizes remain small, and confidence intervals for the statistics presented in the mapping are larger than would ideally be the case.
It is also likely that due to mapping only including responses from participants who provided a postcode / local authority, that this data is skewed towards those population groups who are more likely to provide this information in social research. The data presented here may therefore overrepresent the views of certain groups living in an area and underrepresent the views of others.
To achieve nationally representative results, weights must be applied when analysing the data. The weights were derived to calculate statistics for England and might not be accurate for different spatial scales. As specific weights for LA and LNRS levels are not available, the national level weights were applied.
Section 3.21 Module 21. Designated and Defined Areas
This module incorporates a selection of maps for use as reference and background information.
Please note that the data presented on the website represents the most up to date version of the respective data sources at the time that Version 2.2 was completed (June 2025).
Some of the reference datasets change fairly frequently and for the most up to date actual version of the data it is advisable to go directly to the source data owner to download the most recent version.
3.21.1 Biodiversity (with Ancient Woodland).
This layer (map 21.1) displays biodiversity related designated and defined areas (Sites of Special Scientific Interest - SSSI, Local Nature Reserves - LNR, National Nature Reserves - NNR, Ancient Woodland).
3.21.2 Ancient Woodland Inventory (Revised).
This map (map 21.2) presents data so far published for the developing new Ancient Woodland Inventory. This dataset will eventually replace the data used in map 18.1 but is currently only available for the depicted areas on the map.
3.21.3 Historic Environment.
This map (map 21.3) displays Scheduled Monuments and Registered Historic Parks and Gardens, Registered battlefields and World Heritage Sites.
3.21.4 Designated Areas.
This map (map 21.4) displays national landscape designations and defined areas (National Parks, Areas of Outstanding Natural Beauty - AONBs and Heritage Coasts).
3.21.5 SPA/SAC/RAMSAR.
This map (map 21.5) displays International biodiversity designations and defined areas. Special Protection Areas (SPA), Special Areas of Conservation (SAC), RAMSAR sites defined under the RAMSAR Convention.
3.21.6 Local Authority Districts Boundaries.
This map (map 21.6) displays Lower (District) Tier Local Authority boundaries (including Unitary Authorities). Note that in V 2.2, the Local Authority boundaries are those for Local Authorities at the 2021 Census.
3.21.7 National Character Areas.
This map (map 21.7) displays the boundaries of the England National Character Areas.
3.21.8 Access Land.
This map (map 21.8) shows designated Access Land, including section 15 land.
3.21.9 National Trails.
This map (map 21.9) shows the routes of all National Trails as designated at time of layer creation (March 2024).
Section 3.22 Module 22. Socio-economic reference maps
This module presents a range of socio - economic contextual data that may of use for quick reference when consulting the Green Infrastructure Maps.
Some of the reference datasets change fairly frequently and for the most up to date actual version of the data it is advisable to go directly to the source data owner to download the most recent version.
3.22.1 - IMD Decile.
This layer (map 22.1) presents MHCLG open data on English Indices of Deprivation decile 2019. Decile 1 represents most deprived and decile 10 least deprived. This map uses Census 2011 LSOA. The IMD is not yet updated for LSOA outputs from the Census 21 and remains the LSOA structure used for the 2019 IMD version issue.
Note on the Index of Multiple Deprivation.
What is the Index of Multiple Deprivation (IMD)?
The Index of Multiple Deprivation, commonly known as the IMD, is the official measure of relative deprivation for small areas in England.
The Index of Multiple Deprivation (IMD) ranks every small area in England from 1 (most deprived area) to 32,844 (least deprived area). These small areas are a statistical geography called Lower-layer Super Output Areas.
The IMD combines information from the seven domains to produce an overall relative measure of deprivation. The domains are combined using the following weights:
- Income Deprivation (22.5%)
- Employment Deprivation (22.5%)
- Education, Skills and Training Deprivation (13.5%)
- Health Deprivation and Disability (13.5%)
- Crime (9.3%)
- Barriers to Housing and Services (9.3%)
- Living Environment Deprivation (9.3%)
The weights were derived from consideration of the academic literature on poverty and deprivation, as well as the levels of robustness of the indicators. A fuller account of the Index of Multiple Deprivation is available from:
https://www.gov.uk/government/statistics/english-indices-of-deprivation-2019
3.22.2 - Population.
This layer (map 22.2) presents Census population 2021 data for population density at LSOA level.
3.22.3 - Health.
This layer (Map 22.3) presents ONS General Health Variable Data (2023) derived from the Census 21. Data is presented at LSOA level giving % reporting by category of general health (very good to very bad).
Section 3.23 Module 23. Environmental Benefits of Nature Tool (EBNT) Data Support Package
Background.
This module compiles the datasets required to complete a BASIC assessment of ecosystem service impact within the Environmental Benefits from Nature (EBN) tool. Many of these datasets make use of (and replicate) existing datasets from the above sections. These have been listed together within a single module for user convenience and reflect the order in which they appear in the EBN tool. Categories such as Nature Designation, Cultural & Historic Importance and Special Recreational Value include multiple datasets. These are listed as required by the tool. An EBNT search is provided via an EBN button at the top of the screen. This returns information from datasets listed below (within a drawn search area) in the format the tool requires. Where multiple attributes are present from each category, the search provides flags to direct user action. Once checked, the custom EBN search output provides the majority of the contextual information required to complement habitat data and complete an assessment. Further instruction on how to use the EBN search and complete an assessment is included in Appendix 1 of the EBN user guide. Users requiring access to the most up to date version of data are encouraged to consult the source data listed, or use the EBNT QGIS template which contains active links to related data servers. This is recommended for large/ more complex sites.
3.23.1 - Agricultural land class
What is this layer?
The Agricultural Land Classification classifies land into grades 1 (best) to 5 (worst) for the whole of England and Wales. Grade 1 land is highly productive and also versatile, so that many types of crop can be grown. Grade 5 land is typically bog or moorland suitable only for extensive grazing. The 'average' grade is 3b. Grades 1 to 3a are considered 'best and most versatile' land which should not be developed.
What data was used?
The Agricultural Land Classification - Provisional (England) covers the whole of England. See Section 2. Source Data.
What are the attributes?
The ALC Grade is displayed. The EBNT Search provides returns listing the different ALC Grades present within the search area and provides a return in a format that can be directly accepted by the EBNT tool. More detail on use of this data within the EBN tool is detailed in the EBN data catalogue.
What are the limitations and caveats to content?
Limited additional areas have a more detailed classification available under 'Post-1988 Agricultural Land classification (England)' which split the grades further to include 3a and 3b. Data uploaded in 2023. More up-to-date information may be available from MAGIC - see Section 2. Source Data.
3.23.2 - Surface Water Availability
What is this layer?
The Environment Agency Catchment Abstraction Management Status for surface water is used as an indicator of water scarcity in a catchment.
What data was used?
The 'Q95' map, i.e. water availability in a very dry year, when low flows are exceeded 95% of the time has been used. See Section 2. Source Data.
What are the attributes?
The attribute listed under 'camscdsq95' have been used. The following attributes which are colour coded within the GI portal display:
- Green = water available
- Orange = restricted water available
- Red = water not available
- Grey = heavily modified water bodies (these are allocated for water supply) and/or discharge-rich catchments.
The EBNT Search provides returns listing the above attributes present within the search area and provides a return in a format that can be directly accepted by the EBNT tool. More detail on use of this data within the EBN tool is detailed in the EBN data catalogue.
What are the limitations and caveats to content?
Data uploaded in 2023.Datasets relate to data available at the time of upload, more up to date data may now be available from the EA website - Section 2 Source Data, this is intended to be addressed through following updates.
3.23.3 - Ground Water Availability
What is this layer?
This data relates to Groundwater Quantitative Status, reported by Environment Agency as part of compliance with the Water Framework Directive. It indicates whether water abstraction from aquifers is sustainable or not, based on whether any of the following four tests are failed:
- Saline intrusion - fail if over-abstraction is causing intrusion of poor-quality water into the groundwater body leading to sustained deterioration in groundwater quality.
- Groundwater dependent terrestrial ecosystems (GWDTE) - fail if water abstraction is having a negative impact on plant communities in wetlands.
- Water balance - fail if abstractions exceed the long-term average recharge and affect low flows.
- Dependent surface water status - fail if groundwater abstractions affect the ecological status of surface water bodies.
What data was used?
Environment Agency data on groundwater body quantitative status. See Section 2. Source Data.
What are the attributes?
The map lists Groundwater name, area, and quantitative status in 2019. Groundwater body quantitative status (high, good, moderate, poor bad) is required by the EBNT. The EBNT Search provides returns listing the attributes present within the search area and provides a return in a format that can be directly accepted by the EBNT tool. More detail on use of this data within the EBN tool is detailed in the EBN data catalogue.
What are the limitations and caveats to content?
Data relates to overall quantitative status in 2019 and is included for the purposes of indicative EBNT assessment only- this was the most up-to-date collated data at the time of development and presents only a subset of reported categories. Full data is available from the EA website using the link provided - See Section 2. Source Data. This may include more up to date assessments. Ensure source data from link provided is used for any formal reporting.
3.23.4 Natural Flood Management Priority
What is this layer?
The Natural Flood Management (NFM) priority dataset has been developed by the Environment Agency to indicate which catchments offer the greatest opportunities for implementing natural flood management options in order to reduce flood risk. It is geared towards targeting agri-environment (ELMs) funding. Catchments are ranked according to:
- The number of flood risk receptors (houses and other properties at risk of flooding in the catchment, based on the EA flood risk receptor database).
- The size of the catchment, assuming that there is greater potential for interventions to make a difference in smaller catchments.
- The percentage of urban area within the catchment, assuming that if the catchment is more than half urban there will be no opportunity for NFM at a scale great enough to make a difference.
- Coastal catchments are excluded on the grounds that there is little if any opportunity for habitats to intercept floodwater before it reaches properties at risk.
What data was used?
See Section 2. Source Data.
What are the attributes?
The attribute listed as Ea_nfm_pri is displayed. This corresponds to the priority level assigned to each area. The EBNT Search provides returns listing the attributes present within the search area and provides a return in a format that can be directly accepted by the EBNT tool. More detail on use of this data within the EBN tool is detailed in the EBN data catalogue.
What are the limitations and caveats to content?
Because this dataset is aimed at targeting agri-environment funding it does not cover all situations of interest for the EBN tool. It excludes urban catchments where there could still be opportunities for sustainable drainage, and coastal catchments where protection from storm surges could be offered by dunes, reefs and saltmarshes. Also, it is recognised that some areas may have access to more detailed flood risk and opportunity mapping. Therefore, users are allowed to over-ride the ranking suggested by this dataset if they have access to better information. This dataset may be subject to change and updated as part of work on Countryside Stewardship targeting. In urban areas additional datasets may be used and manually entered into the EBNT tool (see data catalogue). Data uploaded in 2023, more up to date versions may be available See Section 2. Source Data.
3.23.5 - Water Quality WFD Status
What is this layer?
Under the Water Framework Directive (WFD), both ecological and chemical quality are assessed. This layer repeats data covered under above section 3.5.6 - Water Quality (WFD Biological) above.
What data was used?
See S3.4.6 - Water Quality (WFD Biological) above.
What are the attributes?
The mapped data lists WFD Biological Status. The EBNT Search provides returns list the attributes/status of water quality present within the search area and provides a return in a format that can be directly accepted by the EBNT tool. More detail on use of this data within the EBN tool is detailed in the EBN data catalogue.
What are the limitations and caveats to content?
The EBNT considers Water Framework Directive (WFD), both ecological and chemical quality are assessed. and uses overall classification level. This dataset only considers the former (as it has not been possible at this time to include the full dataset, this will be considered as part of subsequent updates). It therefore only considers part of the assessment. Data relates to 2019 data. A full copy of the datasets, including more up-to-date data is may now be available from the Environment Agency see- Section 2 Data Sources.
3.23.6 Water Quality Management Area.
What is this layer?
The EWCO - Water Quality data set have been selected to indicate the demand for water quality.
What data was used?
See Section 2. Source Data.
What are the attributes?
The "Cat" attribute is displayed. This includes the following:
- High spatial priority
- Not classified
- Not applicable
- Not known
The EBNT Search provides returns listing the priority present within the search area and provides a return in a format that can be directly accepted by the EBNT tool. More detail on use of this data within the EBN tool is detailed in the EBN data catalogue.
What are the limitations and caveats to content?
This dataset includes high priority areas only. Data was uploaded in 2024, More up-to-date information may be available from the FC website - see Section 2. Source Data.
3.23.7 Rainfall
What is this layer?
This dataset lists average rainfall from 1991-2020 provided by the Met Office.
What data was used?
See Section 2. Source Data
What are the attributes
Average rainfall (mm) is displayed as discrete bands that reflect the range inputs required by the EBNT. More detailed rainfall data can be found by accessing the source data above. More detail on use of this data within the EBN tool is detailed in the EBN data catalogue.
What are the limitations and caveats to content?
This dataset includes average rainfall within a relatively low-resolution gridded area. More detailed data may be available from the Met Office see link provided. Rainfall data is used a modifier within the EBN tool for Erosion Protection services. Ideally winter rainfall data would be used to determine demand for this service, but this was not available in the correct format for use.
3.23.8 Soil Drainage
What is this layer?
This layer is blank to highlight the fact that this data is required by the EBN tool but is not available under Open Government Licence. Users are encouraged to source a licence to access the data, or access via MAGIC, checking under licence conditions are compliant for their proposed use.
What data was used?
n/a
What are the attributes
n/a. More detail on how to find the data used within the EBN tool to determine soil drainage is detailed in the EBN data catalogue.
What are the limitations and caveats to content?
n/a.
3.23.9 Population Density
What is this layer?
This duplicates population density information above (see 3.22.2 - Population).
What data was used?
See Section 2. Source Data.
What are the attributes
Population Density / Lower layer Super Output Areas (LSAO) is displayed with banded ranges used by the EBNT. More detailed information may be accessed via the population section of the site see above.
3.23.10 Nature Designation
What is this layer?
This duplicates nature designation datasets from above SPA, SAC, RAMSAE (see 3.21.5 SPA/SAC/RAMSAR) SSSI NNR, National Park , LNR, (see 3.21.1 Biodiversity (with Ancient Woodland), and Marine Conservation Zones
What data was used?
See Section 2. Source Data.
What are the attributes
Designation name is displayed by clicking on each of the above datasets. The EBNT counts the number of designations within the search area - as required by the EBNT More detail on use of this data within the EBN tool is detailed in the .
What are the limitations and caveats to content?
More up to data designation data may be available from MAGIC- see section 2. source data.
3.23.11 Ancient Habitat
What is this layer?
This duplicates ancient woodland inventory from (see 3.21.1 Biodiversity (with Ancient Woodland).
What data was used?
See Section 2. Source Data.
What are the attributes
The site displays each ancient woodland name. The EBN search returns Yes or No dependent on presence in the search area. More detail on use of this data within the EBN tool is detailed in the EBN data catalogue.
What are the limitations and caveats to content?
More up to data designation data may be available from MAGIC- see Section 2. source data.
3.23.12 Cultural & Historic Importance
What is this layer?
This duplicates National Park, National Landscapes (Area of Outstanding Natural Beauty) (b 3.21.4 Designated Areas)and Scheduled Ancient Monument, Registered Parks and Gardens, Registered Battlefields and Heritage Coast (see 3.21.3 Historic Environment).
What data was used?
See Section 2. Source Data.
What are the attributes
Designation name is provided for each of the above datasets and is accessed by clicking on mapped data. The EBN search records number of different designations within the search area as required by this indicator within the EBNT. More detail on use of this data within the EBN tool is detailed in the EBN data catalogue.
3.23.13 Special Recreational value
What is this layer?
This duplicates National Landscapes (Area of Outstanding Natural Beauty,) national park and heritage coast (see 3.21.4 Designated Areas) data from above sections.
What data was used?
See Section 2. Source Data.
What are the attributes
The site displays AONB, National Park and Heritage coast name. The EBN search counts the number of designations present from the above dataset list to provide a number, as required by the EBN tool. More detail on use of this data within the EBN tool is detailed in the EBN data catalogue.
What are the limitations and caveats to content?
More up to data designation data may be available from MAGIC- see section 2. source data.
3.23.14 Public Access
What is this layer?
This duplicates the Accessible Green Space dataset.
What data was used?
See Section 2. Source Data.
What are the attributes
Area (ha) of Accessible Green Space under related datasets. The EBN search tool returns "Public Access" or "Footpath" if present within the search area. This is the data required by the EBNT. More detail on use of this data within the EBN tool is detailed in the EBN data catalogue.
What are the limitations and caveats to content?
Does not include private access provisions that may be included in the EBNT.
3.23.15 Educational Access
Duplicates the Public Access datasets (above) as this forms part of the Educational Access scoring within the EBNT. EBNT search returns under this heading are based on the same data.
What are the limitations and caveats to content?
Does not include private access provisions that may be included in the EBNT. More detail on use of this data within the EBN tool is detailed in the EBN data catalogue.
Does not include specific educational access provision also required by the EBNT, due to lack of available data - see EBN data catalogue.
3.23.16 Managed for Nature
Currently this only includes Countryside Stewardship as the only dataset under this heading.
Countryside Stewardship
What is this layer?
The Countryside Stewardship dataset shows higher tier agri-environment agreements where land is managed for nature.
What data was used?
See Section 2. Source Data.
What are the attributes?
The site displays the end date of the agreement and confirms its live status. EBNT Search provides returns listing whether an agreement is present within the search box and provides a return in a format that can be directly accepted by the EBNT tool, under managed for nature. More detail on use of this data within the EBN tool is detailed in the EBN data catalogue.
What are the limitations and caveats to content?
This dataset includes high tier countryside stewardship agreements only. Other areas may be managed for nature - see EBN data catalogue and will need to be entered manually.