Mapping Analysis
Findings from GI Mapping Analysis using the Accessible Greenspace Standards
Introduction
Natural England has analysed access to greenspace across England by applying the Green Infrastructure Framework's Accessible Greenspace Standards to the data held in the Green Infrastructure Mapping Database. The method and findings for 2020, 2022 and 2024 are set out below. They contribute to Defra's 25 Year Environment Plan Outcome Indicator Framework reporting.
Natural England's Accessible Greenspace Standards
The Accessible Greenspace Standards are one of 5 headline Green Infrastructure Standards within the Green Infrastructure Framework. The Accessible Greenspace Standards are set out below.
- Size and Proximity criteria: Everyone has access to good quality green and blue spaces close to home for health and wellbeing and contact with nature, to meet the Accessible Greenspace Standards size and proximity criteria, with an initial focus on access to green and blue spaces within 15 minutes' walk from home. (The size and proximity criteria are set out below in Table 1.)
- Capacity criteria: Local authorities have at least 3 hectares of publicly accessible greenspace per 1,000 population and there is no net loss or reduction in amount of accessible greenspace per 1,000 population at an area-wide scale. Local authorities specify capacity targets for all major residential development informed by a local accessible greenspace baseline, and considering local needs, opportunities and constraints.
- Quality criteria: Accessible greenspace meets the Green Flag Award Criteria, (Ellicott, 2016) and best practice in accessibility for all: By All Reasonable Means: Least restrictive access to the outdoors (The Sensory Trust, 2020).
Natural England estimates that it takes 15 minutes to walk 1 kilometre.
The size and proximity criteria are set out below.
Table 1 Accessible Greenspace Standards size and distance criteria
| Accessible Greenspace Standard criteria | Description | Buffer size |
|---|---|---|
| Doorstep Standard | Accessible Greenspace and Playing Fields of at least 0.5 ha within 200 m from home. The incorporation of Playing Fields is unique to this buffer. | 200 m |
| Local Standard | Accessible Greenspace of at least 2 ha within 300 m from home. | 300 m |
| Neighbourhood Standard | Accessible Greenspace of at least 10 ha within 1 km from home. | 1 km |
| Wider Neighbourhood Standard | Accessible Greenspace of at least 20 ha within 2 km from home. | 2 km |
| District | Accessible Greenspace of at least 100 ha within 5 km from home. | 5 km |
| Sub-Regional | Accessible Greenspace of at least 500 ha of within 10 km from home. | 10 km |
Natural England has also developed a 'Local Greenspace Combined Buffer' which identifies the population that is covered by at least one of the first three Accessible Greenspace Standards buffers, i.e. Doorstep (200 m), Local (300 m) and Neighbourhood (1 km). This measure is reported at national level in the Environmental Improvement Plan's Outcome Indicator Framework, as an indicator for 'Enhancement of Green and Blue Infrastructure (G3)'. It is helpful in identifying places where there is least greenspace provision, but needs to be considered alongside policy, other local information and community engagement.
For further information about the purpose and application of the Accessible Greenspace Standards: Green Infrastructure Standards Summary (Natural England 2023) and Accessible Greenspace Standards User Guide(interim) (Natural England 2024).
Findings
Percentage of the total population in England living in close proximity to greenspace, 2020 to 2024
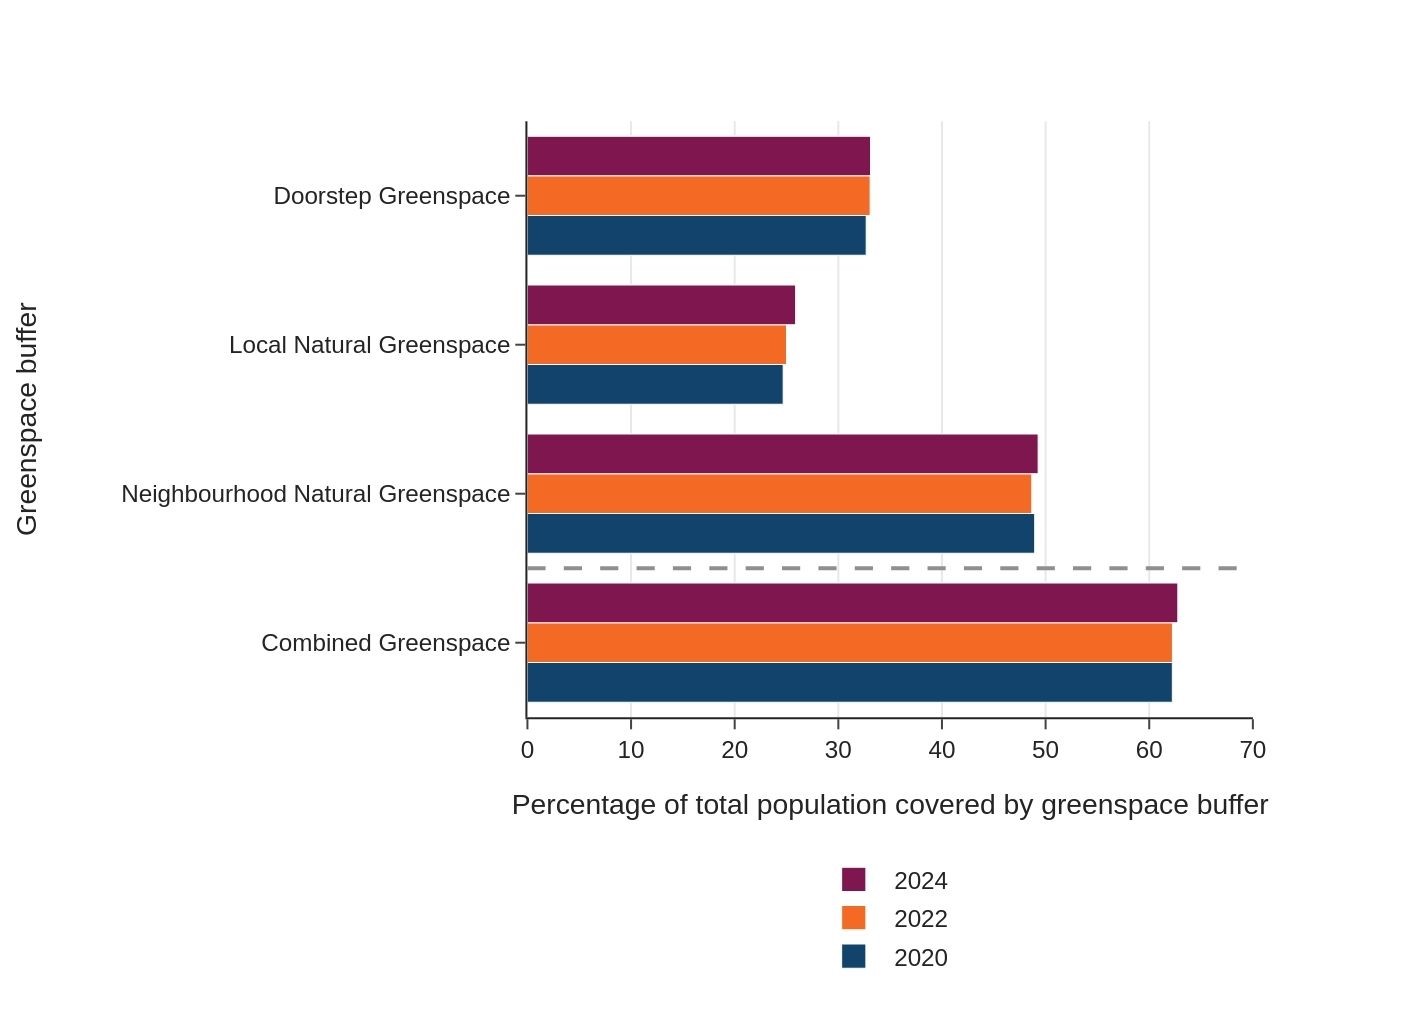
Table 2 Percentage of the total population in England living in close proximity to greenspace, 2020 to 2024
| Year | Doorstep Greenspace | Local Natural Greenspace | Neighbourhood Natural Greenspace | Combined Greenspace |
|---|---|---|---|---|
| 2020 | 32.69 | 24.68 | 48.95 | 62.23 |
| 2022 | 33.07 | 25.00 | 48.67 | 62.24 |
| 2024 | 33.11 | 25.88 | 49.28 | 62.76 |
Source: Natural England
Assumptions
- The analysis uses straight line 'as-the-crow-flies' distances understand how many people live within a certain distance of greenspaces, i.e. aiming to approximate the catchment of each greenspace based on its size. Distances will be further when actually travelled i.e. 'on the ground'. (See caveats and limitations in GI Mapping Database User Guide).
- The 'percentage of total population covered by greenspace buffer' is based on an assumption that the population within each lower layer super output area (LSOA) is evenly distributed.
- Work to understand the margins for error in the data is ongoing and any figures extracted are those that can be detected in the data in its current form with no correction for error.
Conclusions
Between 2020 and 2024, the proportions of the population living in close proximity to greenspace has remained relatively stable in all the categories. There are small increases in all categories, with the largest being an increase of just over 1% in the Local Natural Greenspace category. Overall, across the 3 data points currently available, results suggest that approximately:
- 1 in 3 people live within 200 metres of a Doorstep Greenspace of at least 0.5 hectares
- 1 in 4 people live within 300 metres of a Local Natural Greenspace of at least 2 hectares
- 1 in 2 people live within 1 km of a Neighbourhood Natural Greenspace of at least 10 hectares
When considered together at a point in time, these 3 most local Accessible Greenspace Standards criteria (as set out above) allow us to form a composite picture of accessible greenspace close to home. Findings suggest that almost 2 in 3 people (62.8% in 2024) have access to greenspace as defined by one or more of the Doorstep Greenspace, local Natural Greenspace and Neighbourhood Natural Greenspace Standards included within this indicator, and hence within a maximum 1 km radius of home.
Further Information
Definitions
Accessible Greenspace
Accessible Greenspace is defined as a greenspace that is
- specifically provided FOR public access, or
- one to which the public would usually expect to access (such as a cemetery), or
- one over which there is a public RIGHT to open access, and
- deemed likely to be accessible to the public at any reasonable time, (although some sites may be closed to the public overnight)
- free to entry (although there may be fees for parking a vehicle) and
- available for a range of pastimes).
Accessible greenspaces are available to all, meaning that every reasonable effort is made to comply with the requirements of the Equality Act 2020.
There are a range of types of greenspaces included within the definition of publicly accessible greenspace (listed under Green Infrastructure). The GI Mapping Database User Guide sets out how Accessible Greenspace has been interpreted in developing the GI Mapping.
Accessible Natural Greenspace
Greenspaces meeting the definitions of Accessible Greenspace and Natural Greenspace.
Please see Glossary for full definitions of greenspace.
Types of accessible greenspace in scope of the Accessible Greenspace Standards
The types of Accessible Greenspace that are included in the scope of the Accessible Greenspace Standards are:
Table 3 Publicly Accessible Greenspace and Accessible Natural Greenspace used in the Accessible Greenspace Assessment
| Dataset | Attribute | Used in Accessible Greenspace Standards |
|---|---|---|
| OS Greenspace | Playing Field | Yes, but only for the Doorstep Greenspace Standard |
| OS Greenspace | Public Park or Garden | Yes |
| Local Nature Reserve | Local Nature Reserve | Yes |
| Natural England open access data (including section 15) | Natural England open access data (including section 15) | Yes |
| Millennium Greens | Millennium Green | Yes |
| Doorstep Greens | Doorstep Green | Yes |
| Country Parks | Country Park | Yes |
Method
Non-technical summary of the method
The method uses a combination of the Office for National Statistics (ONS) census, ONS Lower Super Output Areas (LSOA), and Natural England Accessible Greenspaces data.
For each time period, (2020, 2022 and 2024) Office of National Statistics census data on population in England was matched and linked to small neighbourhoods called Lower Super Output Areas (a Census geographic area with approx. 1-3,000 residents in each).
A buffer or 'catchment' was added around each accessible greenspace according to its size using the Accessible Greenspace Standards size and distance criteria. I.e.
- A 200m buffer was created around accessible green spaces of at least 0.5ha in size, in accordance with the Doorstep Greenspace Standard.
- A 300m buffer was created around accessible greenspaces which are at least 2.0 ha in size in accordance with the Local Natural Greenspace Standard.
- A 1km buffer was created around accessible greenspaces which are at least 10.0 ha in size, in accordance with the Neighbourhood Natural Greenspace Standard.
The buffers described above were merged to create a combined buffer.
The population of each LSOA was multiplied by the percentage cover of each buffer within that LSOA.
Under the assumption that the population within each LSOA is evenly distributed (as stated in the G3a indicator), this shows the amount of the population that is within the various catchments for different size greenspaces.
Technical description of the method
The method uses a combination of the Office for National Statistics (ONS) census, ONS Lower Super Output Areas (LSOA), and Natural England accessible greenspaces data published under the Open Government License. All analyses were carried out using R (version 4.2.3 and packages), and ArcGIS Pro (version 3.4.0).
The first step in undertaking the Accessible Greenspace Standards analysis was to filter the 2011 and 2021 ONS census population data (using R version 4.2.3) to only include LSOAs within England. The ONS 2011 and 2021 LSOAs were also filtered to only include those within England. Finally, each set of census population data was joined to the respective LSOAs.
The table below shows the GI Data version, the Census data used for each year of the reporting.
| GI Reporting Year | GI Data Version | Census Data - Year |
|---|---|---|
| 2020 | V1.2 | 2011 |
| 2022 | V2.1 | 2021 |
| 2024 | V2.2 | 2021 |
The second step was to create buffers around the accessible greenspaces in each set of data (Version 1.2, 2.1 and 2.2) using the Accessible Greenspace Standards size and distance criteria. I.e.
- A 200m buffer was created around accessible green spaces of at least 0.5ha in size, in accordance with the Doorstep Greenspace Standard.
- A 300m buffer was created around accessible greenspaces which are at least 2.0 ha in size in accordance with the Local Natural Greenspace Standard.
- A 1km buffer was created around accessible greenspaces which are at least 10.0 ha in size in accordance with the Neighbourhood Natural Greenspace Standard.
Following creation of the three buffers described above, they were also merged and dissolved to create a combined buffer.
The LSOA boundaries were intersected with each of the 4 buffers to calculate the percentage of each LSOA area covered by each buffer. This step was carried out using ArcGIS pro (Version 3.4.0)
The population of each LSOA was multiplied by the percentage cover of each buffer within that LSOA. Under the assumption that the population within each LSOA is evenly distributed (as stated in the G3a indicator), this shows the amount of the population that is within the various catchments for different greenspaces.
The total percentage of the country's population within the four previously mentioned buffers was calculated, by summing the population covered by each buffer across all LSOAs in England. This step was carried out in R.
Please see below for further information about the datasets and software used.
Datasets used in the analysis
| Dataset name | Source | Link |
|---|---|---|
| Census 2021 | ONS | 2021 Census - Census of Population - Data Sources - home - Nomis - Official Census and Labour Market Statistics |
| Census 2011 | ONS | 2011 Census - Census of Population - Data Sources - home - Nomis - Official Census and Labour Market Statistics |
| Lower layer Super Output Areas (2021) | ONS | Lower layer Super Output Areas (December 2021) Boundaries EW BFC (V10) | Open Geography Portal |
| Lower layer Super Output Areas (2011) | ONS | Lower layer Super Output Areas (December 2011) Boundaries EW BSC (V4) | Open Geography Portal |
| Green and Blue Infrastructure – v1.2 | Natural England | Archive. Data can be requested through a Freedom of Information enquiry. |
| Green and Blue Infrastructure – v2.1 | Data.Gov.Uk |
Green and Blue Infrastructure (England) - data.gov.uk
ANGSt_Benchmarks subfolder |
| Green and Blue Infrastructure – v2.1 | Natural England | Data will be published as open data in summer 2025. Data can be requested through a Freedom of Information enquiry. |
Software
- R version 4.2.3 (2023-03-15 ucrt) – Packages:
- arcgisbinding version 1.0.1.311
- dplyr version 1.1.4
- sp version 2.0-0
- sf version 1.0-14
- ArcGIS Pro version 3.4.0